## Radar Chart: Performance Comparison
### Overview
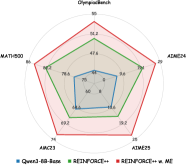
This image presents a radar chart comparing the performance of three different models – Qwen1-5B-Base (blue), REINFORCE++ (green), and REINFORCE++ w. ME (red) – across five different benchmarks: MATH/500, AZME24, AMCZ23, ATME25, and Olympickbench. The chart uses a pentagonal shape, with each vertex representing a benchmark. The distance from the center of the chart indicates the performance score on that benchmark.
### Components/Axes
* **Benchmarks (Vertices):**
* MATH/500 (Left vertex, approximately 9 o'clock)
* AZME24 (Top-right vertex, approximately 2 o'clock)
* AMCZ23 (Bottom-right vertex, approximately 8 o'clock)
* ATME25 (Bottom-left vertex, approximately 4 o'clock)
* Olympickbench (Top vertex, approximately 12 o'clock)
* **Radial Scale:** The scale ranges from 0 to 100, with concentric circles representing increasing scores. The scale is marked at intervals of 25.
* **Legend:** Located in the bottom-left corner, the legend identifies the color-coding for each model:
* Blue: Qwen1-5B-Base
* Green: REINFORCE++
* Red: REINFORCE++ w. ME
### Detailed Analysis
Let's analyze each model's performance across the benchmarks:
* **Qwen1-5B-Base (Blue):**
* MATH/500: Approximately 48.4
* AZME24: Approximately 7.6
* AMCZ23: Approximately 46.6
* ATME25: Approximately 8
* Olympickbench: Approximately 50
* Trend: The blue line shows relatively low and fluctuating performance across all benchmarks.
* **REINFORCE++ (Green):**
* MATH/500: Approximately 78.6
* AZME24: Approximately 9.6
* AMCZ23: Approximately 69.2
* ATME25: Approximately 18.2
* Olympickbench: Approximately 47.6
* Trend: The green line generally shows higher performance than Qwen1-5B-Base, but with significant variation across benchmarks.
* **REINFORCE++ w. ME (Red):**
* MATH/500: Approximately 82.3
* AZME24: Approximately 24.2
* AMCZ23: Approximately 76.2
* ATME25: Approximately 15.2
* Olympickbench: Approximately 64.2
* Trend: The red line consistently demonstrates the highest performance across most benchmarks, indicating that the "w. ME" modification improves the model's capabilities.
### Key Observations
* **REINFORCE++ w. ME consistently outperforms both other models.** It shows the highest scores on MATH/500, AMCZ23, and Olympickbench.
* **Qwen1-5B-Base consistently underperforms.** It has the lowest scores across all benchmarks.
* **AZME24 is a challenging benchmark for all models.** All models have relatively low scores on this benchmark.
* **MATH/500 shows the largest performance difference between models.** The gap between Qwen1-5B-Base and REINFORCE++ w. ME is substantial on this benchmark.
### Interpretation
The radar chart clearly demonstrates the effectiveness of the "w. ME" modification to the REINFORCE++ model. This modification leads to significant performance improvements across a range of benchmarks, particularly in areas like MATH/500 and Olympickbench. The chart suggests that the "w. ME" component addresses limitations in the base REINFORCE++ model, resulting in a more robust and capable system. The consistently low performance of Qwen1-5B-Base indicates that it may require further development or optimization to compete with the REINFORCE++ models. The low scores on AZME24 suggest that this benchmark represents a particularly difficult challenge for all models, potentially highlighting a specific area where further research is needed. The visual representation allows for a quick and intuitive comparison of the models' strengths and weaknesses across different tasks.