## Chart/Diagram Type: Layered Entropy Analysis Graphs
### Overview
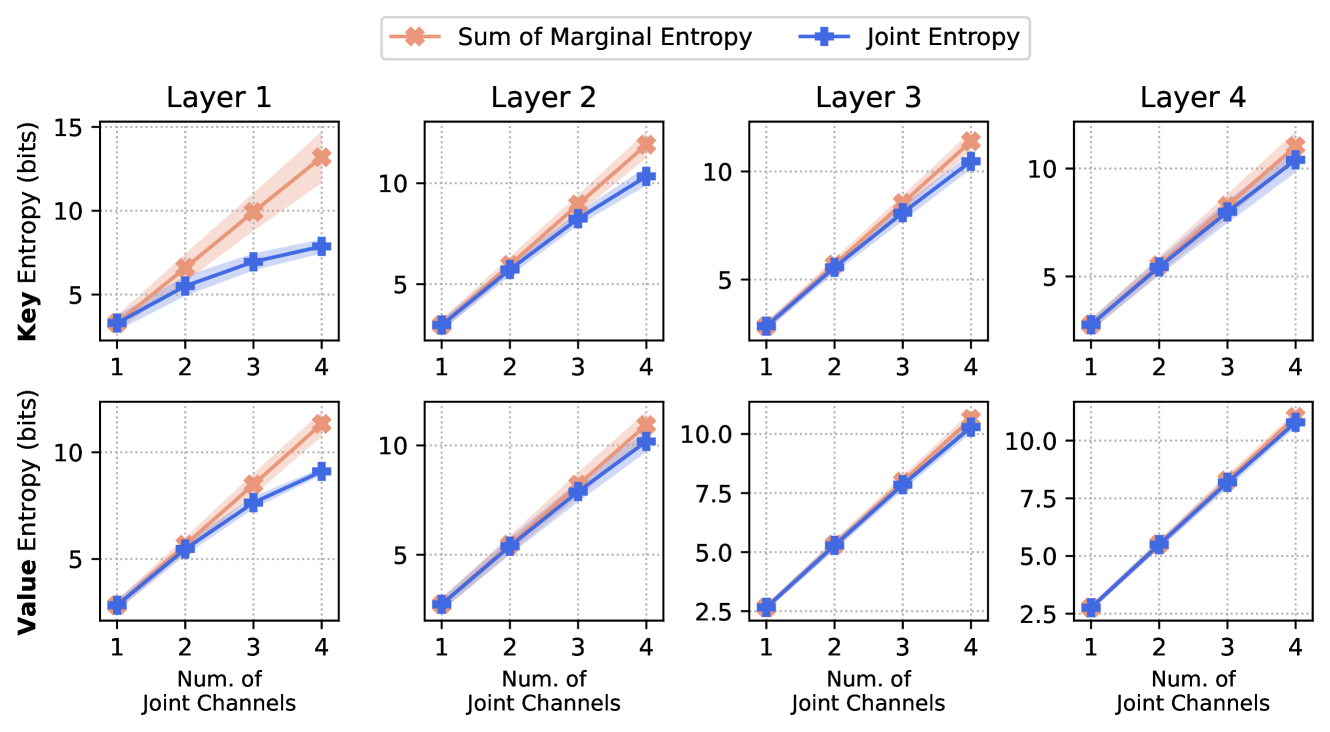
The image contains eight line graphs arranged in a 2x4 grid, each representing entropy metrics across four layers (Layer 1–4). Each layer has two graphs: one for **Key Entropy** (y-axis) and one for **Value Entropy** (y-axis), both plotted against the number of joint channels (x-axis: 1–4). The graphs compare **Sum of Marginal Entropy** (red) and **Joint Entropy** (blue), with trends showing increasing entropy as joint channels increase.
### Components/Axes
- **X-axis**: "Num. of Joint Channels" (values: 1, 2, 3, 4)
- **Y-axis (Top Row)**: "Key Entropy (bits)" (range: 0–15)
- **Y-axis (Bottom Row)**: "Value Entropy (bits)" (range: 0–10)
- **Legend**:
- Red circles: **Sum of Marginal Entropy**
- Blue crosses: **Joint Entropy**
- **Graph Titles**: Layer 1 (top-left), Layer 2 (top-center-left), Layer 3 (top-center-right), Layer 4 (top-right), with corresponding Key/Value Entropy graphs below each.
### Detailed Analysis
#### Layer 1
- **Key Entropy**:
- Sum of Marginal Entropy (red): Starts at ~2 bits (1 joint channel), rises to ~14 bits (4 joint channels).
- Joint Entropy (blue): Starts at ~2 bits, rises to ~8 bits.
- **Value Entropy**:
- Sum of Marginal Entropy (red): Starts at ~2 bits, rises to ~11 bits.
- Joint Entropy (blue): Starts at ~2 bits, rises to ~9 bits.
#### Layer 2
- **Key Entropy**:
- Sum of Marginal Entropy (red): ~2 → ~14 bits.
- Joint Entropy (blue): ~2 → ~12 bits.
- **Value Entropy**:
- Sum of Marginal Entropy (red): ~2 → ~11 bits.
- Joint Entropy (blue): ~2 → ~10 bits.
#### Layer 3
- **Key Entropy**:
- Sum of Marginal Entropy (red): ~2 → ~14 bits.
- Joint Entropy (blue): ~2 → ~12 bits.
- **Value Entropy**:
- Sum of Marginal Entropy (red): ~2 → ~11 bits.
- Joint Entropy (blue): ~2 → ~10 bits.
#### Layer 4
- **Key Entropy**:
- Sum of Marginal Entropy (red): ~2 → ~14 bits.
- Joint Entropy (blue): ~2 → ~12 bits.
- **Value Entropy**:
- Sum of Marginal Entropy (red): ~2 → ~11 bits.
- Joint Entropy (blue): ~2 → ~10 bits.
### Key Observations
1. **Consistent Trends**:
- Both **Sum of Marginal Entropy** (red) and **Joint Entropy** (blue) increase linearly with the number of joint channels across all layers.
- **Sum of Marginal Entropy** consistently exceeds **Joint Entropy** in all layers.
2. **Layer-Specific Patterns**:
- Key Entropy graphs (top row) show steeper increases than Value Entropy graphs (bottom row).
- Layer 1 has the highest Key Entropy values, while Layer 4 has the lowest Key Entropy values.
3. **Data Point Accuracy**:
- Red data points (Sum of Marginal Entropy) are always above blue points (Joint Entropy) in every graph.
### Interpretation
- **Entropy Relationships**:
- The **Sum of Marginal Entropy** (red) represents the total entropy when joint channels are considered independently, while **Joint Entropy** (blue) reflects entropy when channels are analyzed together. The red line’s dominance suggests that marginal contributions dominate over joint effects.
- **Layer Functionality**:
- Key Entropy (top row) likely corresponds to critical features or decision boundaries, while Value Entropy (bottom row) may relate to auxiliary or contextual information. The decline in Key Entropy from Layer 1 to Layer 4 implies a shift from high-dimensional decision-making to more streamlined processing.
- **Practical Implications**:
- The linear relationship between joint channels and entropy indicates that adding channels proportionally increases system complexity. This could inform optimization strategies for neural networks or information compression algorithms.
### Spatial Grounding
- **Legend**: Top-right corner, clearly associating red with Sum of Marginal Entropy and blue with Joint Entropy.
- **Graph Layout**: Each layer’s graphs are stacked vertically (Key Entropy above Value Entropy), with layers ordered left-to-right (Layer 1–4).
- **Axis Consistency**: X-axis labels and scales are uniform across all graphs, ensuring comparability.
### Content Details
- **Numerical Values**:
- All graphs start at ~2 bits for 1 joint channel, with incremental increases (e.g., Layer 1 Key Entropy: +1 bit per channel).
- Final values at 4 joint channels: Key Entropy ~14 bits, Value Entropy ~11 bits.
- **Trend Verification**:
- Red lines (Sum of Marginal Entropy) slope upward more steeply than blue lines (Joint Entropy) in all layers.
### Final Notes
The data underscores the trade-off between marginal and joint entropy in layered systems, with implications for understanding information flow and redundancy in hierarchical models. The consistent patterns suggest a designed relationship between channel count and entropy, potentially reflecting architectural constraints or optimization goals.