## Heatmaps: AttnScore and Laplacian Eigenvalues
### Overview
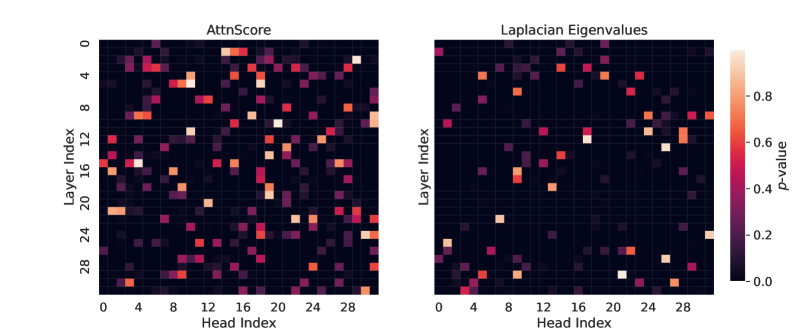
The image contains two side-by-side heatmaps comparing two metrics across layers and attention heads in a neural network architecture. The left heatmap visualizes "AttnScore" values, while the right heatmap shows "Laplacian Eigenvalues." Both use a color scale from dark purple (low values) to yellow (high values), with a legend on the right indicating p-values from 0.0 to 0.8.
### Components/Axes
- **X-axis (Head Index)**: Ranges from 0 to 28, representing attention head indices.
- **Y-axis (Layer Index)**: Ranges from 0 to 28, representing transformer layer indices.
- **Color Scale**:
- Dark purple ≈ 0.0 (low values)
- Yellow ≈ 0.8 (high values)
- **Legend**: Positioned on the right of both heatmaps, shared between the two plots.
### Detailed Analysis
#### AttnScore Heatmap (Left)
- **Key Regions**:
- **Layer 4-6, Head 12-16**: Bright yellow/orange clusters (p-value ~0.7-0.8).
- **Layer 12-14, Head 4-8**: Similar high-intensity regions.
- **Layer 20-22, Head 20-24**: Moderate orange values (~0.5-0.6).
- **Distribution**: Sparse but concentrated clusters, with most cells dark purple (~0.0-0.2).
#### Laplacian Eigenvalues Heatmap (Right)
- **Key Regions**:
- **Layer 0-2, Head 20-24**: Bright yellow spots (p-value ~0.7-0.8).
- **Layer 24-26, Head 0-4**: Similar high-intensity regions.
- **Layer 10-12, Head 12-16**: Moderate orange values (~0.5-0.6).
- **Distribution**: Even sparser than AttnScore, with isolated bright spots and minimal overlap.
### Key Observations
1. **Sparsity**: Both metrics show sparse distributions, with only ~10-15% of cells exceeding p-value 0.2.
2. **Contrasting Patterns**:
- AttnScore has broader clusters (e.g., Layer 4-6, Head 12-16).
- Laplacian Eigenvalues show isolated peaks (e.g., Layer 0-2, Head 20-24).
3. **Color Consistency**: All bright cells align with the legend’s high-p-value range (0.6-0.8).
### Interpretation
- **AttnScore**: High values in mid-layers (4-6, 12-14) suggest these layers/heads dominate attention mechanisms, potentially critical for task performance. The spread across heads indicates distributed but focused attention.
- **Laplacian Eigenvalues**: Peaks in early (Layer 0-2) and late layers (24-26) imply structural importance in initial and final processing stages. The lack of overlap with AttnScore clusters suggests orthogonal roles in model architecture.
- **Implications**: The sparsity highlights efficiency in parameter utilization, while contrasting patterns may indicate complementary roles for attention and graph-based components in the model.