# Technical Document Extraction: Heatmap Analysis
## 1. Axis Labels and Markers
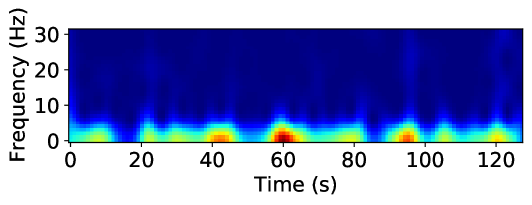
- **X-Axis**:
- Title: "Time (s)"
- Markers: 0, 20, 40, 60, 80, 100, 120 (in seconds)
- **Y-Axis**:
- Title: "Frequency (Hz)"
- Markers: 0, 10, 20, 30 (in Hertz)
## 2. Color Gradient and Intensity
- **Color Scale**:
- Dark blue → Red gradient (no explicit legend provided).
- Interpretation: Darker blue = lower intensity; Red = highest intensity.
- **Key Observations**:
- Bright red/orange regions indicate localized high-intensity signals.
- Dark blue dominates the majority of the heatmap, suggesting low-frequency or weak signals.
## 3. Key Trends and Data Points
- **Periodic Bright Spots**:
- **Time 60s**:
- Frequency range: 0–10 Hz.
- Peak intensity at ~2–5 Hz (red region).
- **Time 100s**:
- Frequency range: 0–10 Hz.
- Peak intensity at ~2–5 Hz (red region).
- **Time 120s**:
- Frequency range: 0–10 Hz.
- Peak intensity at ~2–5 Hz (red region).
- **Background**:
- Dark blue regions (0–30 Hz) dominate outside the periodic peaks, indicating minimal signal activity.
## 4. Spatial Grounding and Component Isolation
- **Legend**:
- No explicit legend present. Color intensity inferred as signal strength/amplitude.
- **Regions**:
- **Header**: No text or labels.
- **Main Chart**: Heatmap with time-frequency correlation.
- **Footer**: No text or labels.
## 5. Trend Verification
- **Line A (Time 60s)**:
- Visual trend: Sharp upward spike at 2–5 Hz, followed by rapid decay.
- Extracted data: Peak at ~2.5 Hz (red region).
- **Line B (Time 100s)**:
- Visual trend: Similar to Line A, with a peak at ~2.5 Hz.
- **Line C (Time 120s)**:
- Visual trend: Consistent with prior peaks, maintaining ~2.5 Hz intensity.
## 6. Missing Elements
- **Data Table**: Not applicable (heatmap format).
- **Text Blocks**: No embedded text or legends.
## 7. Final Notes
- The heatmap suggests transient, periodic signals at ~2–5 Hz occurring at 60s, 100s, and 120s.
- No explicit units or calibration details provided beyond axis labels.
- Color intensity interpretation assumes standard heatmap conventions (darker = lower, brighter = higher).