## Line Chart: Per-Period Regret Over Time for Different Agents
### Overview
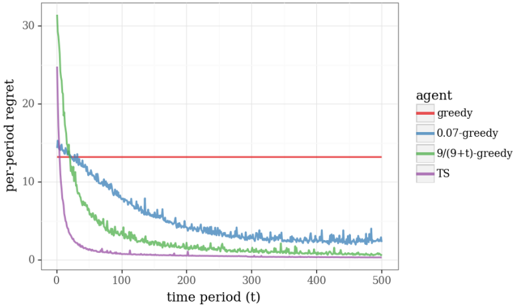
The image is a line chart comparing the performance of four different algorithmic agents over 500 time periods. The performance metric is "per-period regret," where a lower value indicates better performance. The chart demonstrates how the regret of each agent evolves as time progresses.
### Components/Axes
* **Chart Type:** Line chart with multiple series.
* **Y-Axis:**
* **Label:** `per-period regret`
* **Scale:** Linear, ranging from 0 to 30.
* **Major Ticks:** 0, 10, 20, 30.
* **X-Axis:**
* **Label:** `time period (t)`
* **Scale:** Linear, ranging from 0 to 500.
* **Major Ticks:** 0, 100, 200, 300, 400, 500.
* **Legend:**
* **Position:** Right side of the plot area, vertically centered.
* **Title:** `agent`
* **Series (with associated colors):**
1. `greedy` - Red line
2. `0.07-greedy` - Blue line
3. `9/(9+t)-greedy` - Green line
4. `TS` - Purple line
### Detailed Analysis
**Trend Verification & Data Points:**
1. **`greedy` (Red Line):**
* **Trend:** Perfectly horizontal, constant line.
* **Value:** Maintains a per-period regret of approximately **13-14** for all time periods from t=0 to t=500. It shows no learning or improvement.
2. **`0.07-greedy` (Blue Line):**
* **Trend:** Shows a steady, noisy decline. It starts high and decreases at a moderate, consistent rate.
* **Key Points:**
* Starts at t=0 with regret ~**15**.
* At t=100, regret is ~**10**.
* At t=200, regret is ~**6**.
* At t=300, regret is ~**4**.
* At t=500, regret is approximately **2-3**.
3. **`9/(9+t)-greedy` (Green Line):**
* **Trend:** Exhibits a very steep initial decline that rapidly flattens out. It has the highest starting point but converges quickly.
* **Key Points:**
* Starts at t=0 with the highest regret, approximately **30**.
* Drops sharply to ~**10** by t=50.
* At t=100, regret is ~**4**.
* At t=200, regret is ~**1**.
* From t=300 to t=500, it hovers very close to **0** (approximately 0.1-0.5).
4. **`TS` (Purple Line):**
* **Trend:** Shows the fastest initial learning curve, dropping precipitously and then maintaining near-zero regret.
* **Key Points:**
* Starts at t=0 with regret ~**25**.
* Drops extremely quickly, reaching ~**5** by t=25.
* By t=100, regret is already near **0**.
* From t=100 to t=500, it remains essentially at **0**, with minor noise.
### Key Observations
* **Performance Hierarchy (at t=500):** `TS` ≈ `9/(9+t)-greedy` (best, near-zero regret) > `0.07-greedy` (good, low regret) > `greedy` (worst, constant high regret).
* **Learning Speed:** `TS` learns the fastest, followed by `9/(9+t)-greedy`, then `0.07-greedy`. The `greedy` agent does not learn.
* **Initial Conditions:** The agents start with different initial regret levels, with `9/(9+t)-greedy` starting the highest (~30) and `0.07-greedy` the lowest (~15).
* **Convergence:** Both `TS` and `9/(9+t)-greedy` converge to near-zero regret, indicating they have likely identified the optimal action. `0.07-greedy` is still improving slowly at t=500.
### Interpretation
This chart is a classic visualization from the field of **reinforcement learning or multi-armed bandit problems**. It compares the efficiency of different exploration strategies in minimizing regret (the difference between the reward obtained and the reward of the optimal action).
* **`greedy` (Red):** Represents a purely exploitative strategy that never explores. Its constant, high regret shows it is stuck suboptimally.
* **`0.07-greedy` (Blue):** An epsilon-greedy strategy with a fixed, small exploration rate (7%). It learns steadily but slowly because its exploration probability does not decrease over time.
* **`9/(9+t)-greedy` (Green):** A decayed epsilon-greedy strategy where exploration probability decreases as `9/(9+t)`. This allows for aggressive early exploration (high initial regret) that pays off with rapid convergence to the optimal policy.
* **`TS` (Purple):** Likely stands for **Thompson Sampling**, a Bayesian approach. Its performance is superior, showing extremely rapid learning and near-perfect long-term performance. This suggests it efficiently balances exploration and exploitation by maintaining a probability distribution over the expected rewards of each action.
**The core message:** Intelligent, adaptive exploration strategies (`TS`, decayed epsilon-greedy) dramatically outperform naive (`greedy`) or simple fixed-exploration (`0.07-greedy`) strategies in sequential decision-making problems. The chart argues for the use of sophisticated algorithms like Thompson Sampling in such scenarios.