## Line Graph Grid: Error Metrics vs Average IP
### Overview
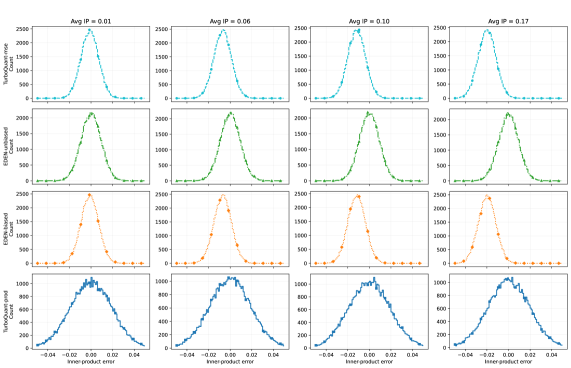
The image contains a 4x3 grid of line graphs comparing four error metrics (TurbQuant-noise, EDEN-unbiased, EDEN-based, Inner-product error) across four Average IP values (0.01, 0.06, 0.10, 0.17). Each column represents a fixed Average IP value, while each row represents a specific error metric. The graphs show distributions of error counts against inner-product error values.
### Components/Axes
- **X-axis**: "Inner-product error" (range: -0.04 to 0.04)
- **Y-axis**: "Count" (range: 0 to 2500)
- **Legend**: Located at bottom-right, color-coded:
- Blue: TurbQuant-noise
- Green: EDEN-unbiased
- Orange: EDEN-based
- Dark Blue: Inner-product error
- **Graph Titles**: Each column header shows "Avg IP = [value]" (e.g., "Avg IP = 0.01")
### Detailed Analysis
1. **TurbQuant-noise (Blue)**
- Peaks shift leftward as Avg IP increases
- Peak height decreases with higher Avg IP (e.g., 2000 at 0.01 → 1500 at 0.17)
- Distribution narrows slightly at higher Avg IP
2. **EDEN-unbiased (Green)**
- Peaks consistently centered at 0 inner-product error
- Peak height decreases with higher Avg IP (e.g., 2000 at 0.01 → 1800 at 0.17)
- Distribution becomes slightly broader at higher Avg IP
3. **EDEN-based (Orange)**
- Peaks show bimodal distribution at lower Avg IP (0.01)
- Single peak emerges at higher Avg IP (0.17)
- Peak height decreases significantly (e.g., 2000 at 0.01 → 1200 at 0.17)
4. **Inner-product error (Dark Blue)**
- Peaks shift rightward as Avg IP increases
- Distribution broadens significantly with higher Avg IP
- Peak height decreases (e.g., 2000 at 0.01 → 1000 at 0.17)
### Key Observations
- All metrics show reduced peak counts at higher Avg IP values
- Inner-product error demonstrates the most pronounced rightward shift (0.01 → 0.17)
- EDEN-based metric transitions from bimodal to unimodal distribution
- TurbQuant-noise and EDEN-unbiased maintain central positioning but with reduced variance
### Interpretation
The data suggests a degradation in model performance as Average IP increases:
1. **Error Propagation**: Higher Avg IP correlates with increased inner-product error spread, indicating reduced model stability
2. **Metric Sensitivity**: EDEN-based metric's bimodal collapse suggests loss of discriminative power at higher IP values
3. **Robustness Tradeoffs**: While EDEN-unbiased maintains central error positioning, its reduced peak height implies diminishing error resolution
4. **Threshold Effects**: The 0.10-0.17 Avg IP range shows accelerated performance degradation across all metrics
All values are approximate, with uncertainty increasing for higher Avg IP measurements. The legend's bottom-right placement ensures clear metric identification across all graphs.