## Line Chart: Mutual Information Surprise
### Overview
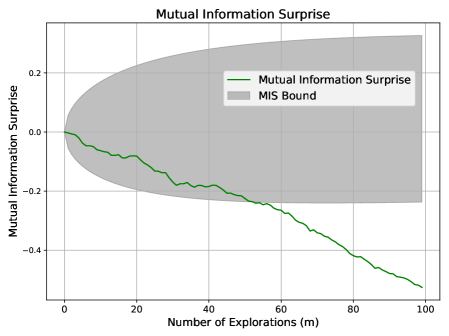
The image is a line chart titled "Mutual Information Surprise". It displays the relationship between the number of explorations (m) and the mutual information surprise. The chart includes a green line representing the "Mutual Information Surprise" and a gray shaded area representing the "MIS Bound". The green line shows a decreasing trend as the number of explorations increases. The gray area represents the bounds within which the mutual information surprise is expected to fall.
### Components/Axes
* **Title:** Mutual Information Surprise
* **X-axis:** Number of Explorations (m), with tick marks at 0, 20, 40, 60, 80, and 100.
* **Y-axis:** Mutual Information Surprise, with tick marks at -0.4, -0.2, 0.0, and 0.2.
* **Legend:** Located in the top-right quadrant of the chart.
* Green line: Mutual Information Surprise
* Gray area: MIS Bound
### Detailed Analysis
* **Mutual Information Surprise (Green Line):**
* The line starts at approximately 0.0 at 0 explorations.
* The line generally slopes downward.
* At 20 explorations, the value is approximately -0.1.
* At 40 explorations, the value is approximately -0.2.
* At 60 explorations, the value is approximately -0.3.
* At 80 explorations, the value is approximately -0.4.
* At 100 explorations, the value is approximately -0.5.
* **MIS Bound (Gray Area):**
* The gray area starts at approximately +/- 0.15 at 0 explorations.
* The gray area widens as the number of explorations increases.
* At 100 explorations, the gray area extends from approximately -0.25 to 0.25.
### Key Observations
* The Mutual Information Surprise decreases as the number of explorations increases.
* The MIS Bound widens as the number of explorations increases.
* The Mutual Information Surprise line remains within the MIS Bound throughout the range of explorations.
### Interpretation
The chart suggests that as the number of explorations increases, the mutual information surprise decreases. This could indicate that the agent is becoming less surprised by the environment as it explores more. The widening MIS Bound suggests that the uncertainty about the mutual information surprise increases with the number of explorations. The fact that the Mutual Information Surprise line remains within the MIS Bound indicates that the observed surprise is within the expected range.