\n
## Line Chart: Mutual Information Surprise
### Overview
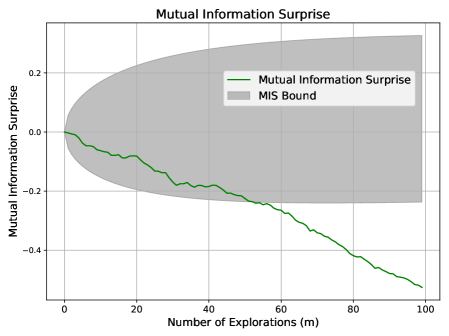
The image presents a line chart illustrating the relationship between the number of explorations (m) and the mutual information surprise. A shaded region represents the MIS Bound. The chart aims to visualize how the mutual information surprise changes as the number of explorations increases.
### Components/Axes
* **X-axis:** Number of Explorations (m), ranging from 0 to 100.
* **Y-axis:** Mutual Information Surprise, ranging from approximately -0.5 to 0.2.
* **Data Series:**
* "Mutual Information Surprise" - represented by a green line.
* **Legend:** Located in the top-right corner.
* Green line: "Mutual Information Surprise"
* Gray shaded area: "MIS Bound"
### Detailed Analysis
The green line representing "Mutual Information Surprise" starts at approximately 0.05 at m=0. The line generally slopes downward as the number of explorations increases.
Here's a breakdown of approximate data points:
* m = 0: Mutual Information Surprise ≈ 0.05
* m = 10: Mutual Information Surprise ≈ -0.05
* m = 20: Mutual Information Surprise ≈ -0.15
* m = 30: Mutual Information Surprise ≈ -0.20
* m = 40: Mutual Information Surprise ≈ -0.25
* m = 50: Mutual Information Surprise ≈ -0.30
* m = 60: Mutual Information Surprise ≈ -0.35
* m = 70: Mutual Information Surprise ≈ -0.40
* m = 80: Mutual Information Surprise ≈ -0.45
* m = 90: Mutual Information Surprise ≈ -0.50
* m = 100: Mutual Information Surprise ≈ -0.52
The "MIS Bound" is represented by a gray shaded region. It starts with a relatively large positive value at m=0 (approximately 0.2) and gradually decreases, becoming more negative as m increases. The lower bound of the shaded region appears to converge towards the "Mutual Information Surprise" line as m approaches 100.
### Key Observations
* The "Mutual Information Surprise" consistently decreases as the number of explorations increases.
* The "MIS Bound" provides an upper and lower limit for the "Mutual Information Surprise".
* The gap between the "Mutual Information Surprise" line and the lower bound of the "MIS Bound" narrows as the number of explorations increases.
* The "Mutual Information Surprise" appears to approach a stable negative value as the number of explorations reaches 100.
### Interpretation
The chart suggests that as the number of explorations increases, the mutual information surprise decreases. This could indicate that with more exploration, the system gains more certainty and reduces its surprise about the environment or data. The "MIS Bound" likely represents a theoretical limit or confidence interval for the mutual information surprise. The convergence of the "Mutual Information Surprise" line towards the lower bound of the "MIS Bound" suggests that the system is approaching a state where the observed surprise is consistent with the theoretical limits. The initial positive surprise at m=0 could represent the initial uncertainty or novelty of the system before any exploration has taken place. The negative values indicate a reduction in surprise, potentially due to learning or adaptation. The chart demonstrates a clear trend of diminishing returns in terms of information gain with increasing exploration.