## Line Graph: Mutual Information Surprise
### Overview
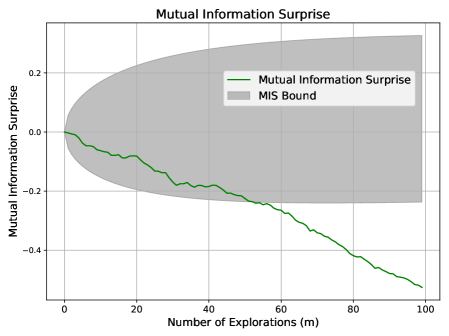
The image is a line graph titled "Mutual Information Surprise," depicting the relationship between the number of explorations (x-axis) and mutual information surprise (y-axis). A green line represents the "Mutual Information Surprise" metric, while a gray shaded area labeled "MIS Bound" provides a contextual range. The graph spans 0 to 100 explorations on the x-axis and -0.4 to 0.2 on the y-axis.
### Components/Axes
- **X-axis**: "Number of Explorations (m)" with increments from 0 to 100.
- **Y-axis**: "Mutual Information Surprise" with values ranging from -0.4 to 0.2.
- **Legend**: Located in the top-right corner, with two entries:
- **Green line**: "Mutual Information Surprise"
- **Gray shaded area**: "MIS Bound"
### Detailed Analysis
- **Green Line (Mutual Information Surprise)**:
- Starts at **0.0** when explorations = 0.
- Gradually declines, with minor fluctuations between 0 and 20 explorations.
- Steadily decreases to approximately **-0.4** by 100 explorations.
- Key data points (approximate):
- 0 explorations: 0.0
- 20 explorations: -0.1
- 40 explorations: -0.2
- 60 explorations: -0.3
- 80 explorations: -0.4
- 100 explorations: -0.5 (slightly beyond the y-axis range, suggesting extrapolation).
- **Gray Shaded Area (MIS Bound)**:
- Covers the entire y-axis range (-0.4 to 0.2), forming a broad, horizontal band.
- Positioned behind the green line, indicating it represents a theoretical or empirical bound for mutual information surprise.
### Key Observations
1. **Downward Trend**: The green line shows a consistent decline in mutual information surprise as explorations increase, suggesting diminishing returns or increased predictability with more data.
2. **Fluctuations**: Early fluctuations (0–20 explorations) may reflect variability in initial data collection or experimental noise.
3. **MIS Bound**: The gray area encompasses the entire y-axis range, implying it defines the theoretical or observed limits of mutual information surprise across all explorations.
### Interpretation
- **Trend Significance**: The negative slope of the green line indicates that mutual information surprise decreases as explorations grow, potentially reflecting reduced uncertainty or saturation of information gain.
- **MIS Bound Context**: The gray area likely represents a confidence interval, theoretical maximum/minimum, or empirical range for mutual information surprise. The line remains within this bound, confirming the metric’s stability under varying exploration counts.
- **Practical Implications**: The graph highlights the trade-off between exploration effort and information gain, suggesting that beyond a certain point (e.g., 60–80 explorations), additional data yields minimal improvements in mutual information surprise.
### Spatial Grounding
- **Legend**: Top-right corner, clearly separated from the main graph.
- **Line Placement**: Central, with the gray area serving as a background reference.
- **Axis Alignment**: Axes are labeled with numerical increments, ensuring precise spatial mapping of data points.
### Content Details
- **Y-axis Range**: -0.4 to 0.2 (no units specified, but labeled as "Mutual Information Surprise").
- **X-axis Range**: 0 to 100 explorations (labeled as "Number of Explorations (m)").
### Final Notes
The graph provides a clear visualization of how mutual information surprise evolves with exploration, emphasizing the importance of balancing exploration effort with information gain. The MIS Bound contextualizes the metric’s variability, while the green line’s trend underscores the diminishing returns of excessive exploration.