## Bar Chart: Total Training Time Comparison
### Overview
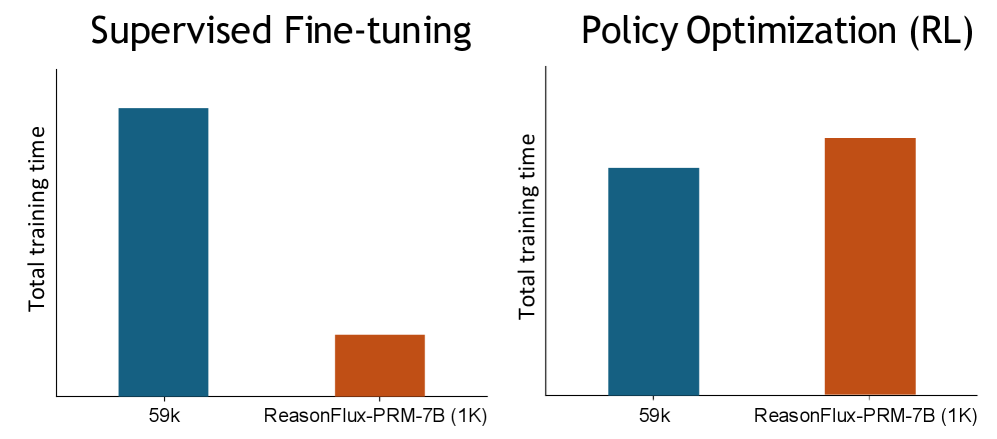
The image presents two bar charts side-by-side, comparing the total training time for two different methods: Supervised Fine-tuning and Policy Optimization (RL). Each chart displays the training time for two categories: "59k" and "ReasonFlux-PRM-7B (1K)". The y-axis represents "Total training time".
### Components/Axes
* **Chart Titles:**
* Left Chart: "Supervised Fine-tuning"
* Right Chart: "Policy Optimization (RL)"
* **Y-axis Label (both charts):** "Total training time"
* **X-axis Labels (both charts):**
* "59k"
* "ReasonFlux-PRM-7B (1K)"
* **Bar Colors:**
* Blue: Represents the "59k" category in both charts.
* Orange: Represents the "ReasonFlux-PRM-7B (1K)" category in both charts.
### Detailed Analysis
**Left Chart: Supervised Fine-tuning**
* **59k (Blue Bar):** The bar extends to approximately the top of the chart. Let's assign it a relative value of 1.0.
* **ReasonFlux-PRM-7B (1K) (Orange Bar):** The bar extends to approximately 20% of the height of the "59k" bar. Let's assign it a relative value of 0.2.
**Right Chart: Policy Optimization (RL)**
* **59k (Blue Bar):** The bar extends to approximately 80% of the height of the chart. Let's assign it a relative value of 0.8.
* **ReasonFlux-PRM-7B (1K) (Orange Bar):** The bar extends to approximately 95% of the height of the chart. Let's assign it a relative value of 0.95.
### Key Observations
* In Supervised Fine-tuning, "59k" requires significantly more training time than "ReasonFlux-PRM-7B (1K)".
* In Policy Optimization (RL), "ReasonFlux-PRM-7B (1K)" requires slightly more training time than "59k".
* The relative training times between "59k" and "ReasonFlux-PRM-7B (1K)" are reversed between the two methods.
### Interpretation
The data suggests that the choice of training method significantly impacts the relative training times of "59k" and "ReasonFlux-PRM-7B (1K)". Supervised Fine-tuning is much more efficient for "ReasonFlux-PRM-7B (1K)" compared to "59k". Conversely, Policy Optimization (RL) is slightly more efficient for "59k" compared to "ReasonFlux-PRM-7B (1K)". This could indicate that "ReasonFlux-PRM-7B (1K)" is better suited for Supervised Fine-tuning, while "59k" might be a better choice for Policy Optimization (RL). The specific units of "Total training time" are not provided, so the absolute differences cannot be quantified.