## Line Graph: Sex-Based Distribution Trends
### Overview
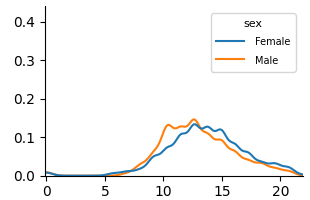
The image depicts a line graph comparing two distributions labeled "Female" (blue) and "Male" (orange) across an x-axis range of 0–20. The y-axis ranges from 0 to 0.4, likely representing a normalized metric (e.g., probability, proportion, or frequency). Both lines exhibit a unimodal distribution with peaks and gradual declines.
### Components/Axes
- **Legend**: Located in the top-right corner, labeled "sex" with two entries:
- Blue line: Female
- Orange line: Male
- **X-axis**: Unlabeled numerical axis spanning 0–20 (approximate intervals: 0, 5, 10, 15, 20).
- **Y-axis**: Unlabeled axis ranging from 0 to 0.4 (approximate intervals: 0, 0.1, 0.2, 0.3, 0.4).
### Detailed Analysis
1. **Female (Blue Line)**:
- Starts near 0 at x=0.
- Gradually increases, peaking at approximately x=14 with a y-value of ~0.18.
- Declines steadily after the peak, reaching ~0.05 at x=20.
- Crosses the Male line near x=12 (y ~0.13).
2. **Male (Orange Line)**:
- Starts near 0 at x=0.
- Rises more sharply than Female, peaking at x=12 with a y-value of ~0.13.
- Declines gradually after the peak, reaching ~0.03 at x=20.
- Crosses the Female line near x=12 (y ~0.13).
### Key Observations
- **Crossover Point**: The lines intersect near x=12, where Male briefly surpasses Female before being overtaken.
- **Peak Differences**: Female peaks later (x=14) and higher (y=0.18) than Male (x=12, y=0.13).
- **Decline Rates**: Both lines decline post-peak, but Female’s decline is steeper after x=16.
### Interpretation
The graph suggests a sex-based divergence in the measured metric:
- **Optimal Range**: Male values dominate between x=10–12, while Female values peak later (x=14), indicating differing optimal points for the metric.
- **Post-Peak Decline**: Both sexes show reduced values beyond their peaks, possibly reflecting diminishing returns or saturation effects.
- **Crossover Significance**: The intersection at x=12 highlights a critical threshold where Male values temporarily exceed Female values, potentially signaling a shift in trends or contextual factors influencing the metric.
### Uncertainties
- Axis labels are missing, so the exact nature of the x-axis variable (e.g., age, score, time) remains unclear.
- Y-axis metric is unspecified but likely a normalized value (e.g., probability density, relative frequency).