\n
## Diagram: Component Assembly Process
### Overview
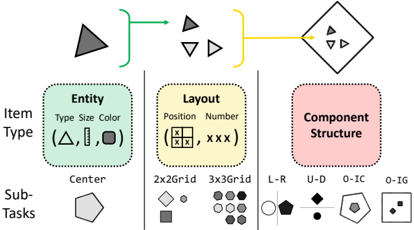
The image is a technical diagram illustrating a three-stage process for constructing a complex component. It shows how a basic "Entity" is combined with a "Layout" specification to produce a final "Component Structure." The diagram is organized into three vertical columns representing these stages, with a horizontal flow from left to right at the top showing the combination process.
### Components/Axes
The diagram is divided into three main vertical sections, each with a title and associated visual examples.
**1. Left Column: Entity**
* **Title:** `Entity`
* **Attributes:** `Type`, `Size`, `Color`
* **Visual Examples (in parentheses):** A triangle (△), a vertical line (|), and a circle (○).
* **Sub-Task Label:** `Center`
* **Sub-Task Visual:** A pentagon shape.
**2. Middle Column: Layout**
* **Title:** `Layout`
* **Attributes:** `Position`, `Number`
* **Visual Examples (in parentheses):** A 2x2 grid icon and the text "XXX".
* **Sub-Task Labels & Visuals:**
* `2x2Grid`: A diamond, a square, a circle, and a smaller circle arranged in a 2x2 pattern.
* `3x3Grid`: Nine circles arranged in a 3x3 pattern.
**3. Right Column: Component Structure**
* **Title:** `Component Structure`
* **Sub-Task Labels & Visuals:**
* `L-R`: A circle next to a pentagon.
* `U-D`: A diamond above a pentagon.
* `O-IC`: A circle inside a pentagon.
* `O-IG`: A circle inside a square, which is inside a larger square.
**Top Flow Diagram:**
* A dark grey triangle (Entity) is enclosed by a green bracket.
* A green arrow points from this bracket to a cluster of three shapes: a dark grey triangle, a white inverted triangle, and a white triangle pointing right (representing a Layout).
* This cluster is enclosed by a yellow bracket.
* A yellow arrow points from this bracket to a final diamond-shaped container.
* Inside the diamond container are the three shapes from the Layout cluster, arranged in a specific pattern.
### Detailed Analysis
The diagram defines a clear, modular workflow:
1. **Input Stage (Entity):** The process begins with a fundamental object defined by its type (shape), size, and color. The example shows a triangle.
2. **Specification Stage (Layout):** This entity is then arranged according to a layout rule. The layout defines the position and number of entity instances. The example shows three triangles arranged in a specific pattern (one dark grey, two white, with different orientations).
3. **Output Stage (Component Structure):** The final product is a composite component where the entities are placed according to the layout. The top flow shows the three triangles from the layout step now contained within a diamond-shaped structure. The bottom section lists various possible structural relationships between components (e.g., Left-Right, Up-Down, Inside-Container, Inside-Inside-Grid).
### Key Observations
* **Color Coding:** The process flow uses colored brackets (green for Entity, yellow for Layout) to visually group the inputs to each stage.
* **Abstraction:** The diagram uses simple geometric shapes (triangles, circles, squares, pentagons) as placeholders for more complex data or UI elements.
* **Hierarchical Breakdown:** Each main stage (Entity, Layout, Component Structure) is further broken down into specific "Sub-Tasks," showing the granularity of the process.
* **Spatial Logic:** The final component structure (diamond container) is a direct spatial mapping of the layout specification.
### Interpretation
This diagram outlines a **generative or compositional design system**. It demonstrates a method for creating complex visual or data structures by combining simple, defined primitives (Entities) according to explicit spatial rules (Layouts). The process is modular and scalable: you can change the Entity (e.g., from a triangle to a circle), change the Layout (e.g., from a 2x2 grid to a linear arrangement), or change the final Component Structure relationship (e.g., from "L-R" to "O-IC") to generate a wide variety of outputs from a small set of rules.
The "Sub-Tasks" listed under each column suggest this is part of a larger computational or design pipeline, where each sub-task is a specific operation (e.g., centering an entity, arranging items in a grid, nesting one shape within another). The diagram serves as a high-level map for understanding how low-level attributes are systematically combined to build higher-order structures.