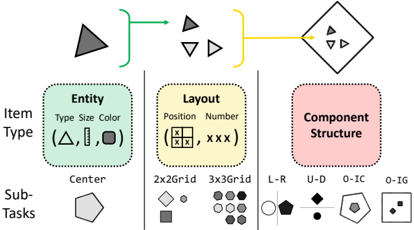
## Diagram: Entity-Layout-Component Structure Workflow
### Overview
The diagram illustrates a three-stage workflow for organizing visual elements: **Entity** (defining attributes), **Layout** (spatial arrangement), and **Component Structure** (hierarchical composition). Arrows indicate progression from left to right, with color-coded sections (green, yellow, pink) representing each stage.
### Components/Axes
1. **Entity Section (Green)**
- **Labels**:
- `Item Type`: Triangle, Vertical Line, Square
- `Size`: Small, Medium, Large
- `Color`: Gray, White, Black
- **Sub-Tasks**:
- `Center`: Pentagon shape
- **Legend**: Green background with triangular bullet points.
2. **Layout Section (Yellow)**
- **Labels**:
- `Position`: 2x2 Grid, 3x3 Grid
- `Number`: L-R (Left-Right), U-D (Up-Down), O-IC (Outside-Inside), O-IG (Outside-Inside Grid)
- **Examples**:
- 2x2 Grid: Diamond, Circle, Square, Triangle
- 3x3 Grid: Gray/White/Black hexagons
- **Legend**: Yellow background with diamond-shaped bullet points.
3. **Component Structure Section (Pink)**
- **Labels**:
- `Structure`: Circle with Line, Diamond with Dot, Pentagon with Square, Circle with Square
- **Legend**: Pink background with square bullet points.
### Detailed Analysis
- **Entity**: Attributes (Type, Size, Color) are defined with geometric shapes and color codes.
- **Layout**: Spatial arrangements use grid systems (2x2, 3x3) and directional/orientation labels (L-R, U-D).
- **Component Structure**: Complex hierarchical compositions combine shapes (e.g., Circle + Line, Diamond + Dot).
### Key Observations
1. **Flow Direction**: Arrows (green → yellow → pink) enforce a strict left-to-right progression.
2. **Color Coding**:
- Green (Entity) → Yellow (Layout) → Pink (Component Structure)
- Matches legend bullet shapes (triangle → diamond → square).
3. **Grid Systems**:
- 2x2 Grid uses basic shapes; 3x3 Grid uses monochromatic hexagons.
4. **Component Complexity**: Structures combine 2+ shapes (e.g., Circle + Line) for hierarchical relationships.
### Interpretation
This diagram represents a **visual design pipeline**:
1. **Entity Definition**: Establishes foundational attributes (shape, size, color) for elements.
2. **Layout Organization**: Arranges entities into grids or directional patterns.
3. **Component Assembly**: Combines entities into higher-order structures, suggesting modular design principles.
The use of grids and directional labels implies a focus on **spatial hierarchy**, while the component examples highlight **compositional logic** (e.g., nesting shapes). The absence of numerical data suggests this is a conceptual framework rather than a quantitative analysis.
**Notable Patterns**:
- Component structures prioritize **asymmetry** (e.g., Circle + Line vs. Diamond + Dot).
- Layout grids transition from simple (2x2) to complex (3x3), mirroring increasing abstraction.