## Line Graph: Accuracy vs. Epoch
### Overview
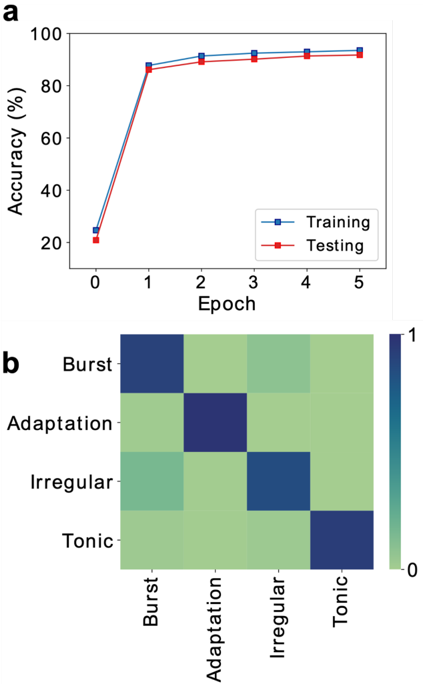
The image contains two visualizations: a line graph (a) showing training and testing accuracy across epochs, and a heatmap (b) comparing categorical relationships. The line graph demonstrates rapid improvement in accuracy followed by stabilization, while the heatmap reveals diagonal dominance in categorical correlations.
### Components/Axes
**Line Graph (a):**
- **X-axis (Epoch):** Discrete values 0–5, labeled "Epoch"
- **Y-axis (Accuracy %):** Continuous scale 0–100%, labeled "Accuracy (%)"
- **Legend:** Top-right corner, with:
- Blue squares: Training accuracy
- Red squares: Testing accuracy
**Heatmap (b):**
- **Rows/Columns:** Labeled "Burst," "Adaptation," "Irregular," "Tonic"
- **Color Scale:** 0 (light green) to 1 (dark blue), labeled with numeric values
- **Legend:** Right side, vertical gradient from light green to dark blue
### Detailed Analysis
**Line Graph (a):**
- **Training Accuracy (Blue):**
- Epoch 0: ~25%
- Epoch 1: ~85% (steep rise)
- Epochs 2–5: ~90% (plateau)
- **Testing Accuracy (Red):**
- Epoch 0: ~20%
- Epoch 1: ~85% (steep rise)
- Epochs 2–5: ~90% (gradual increase)
- **Trend Verification:** Both lines show exponential growth in first epoch, then flatten. Training accuracy remains consistently ~5% higher than testing accuracy throughout.
**Heatmap (b):**
- **Row/Column Categories:**
- Burst: Dark blue (1.0) on diagonal, light green (0.2–0.4) off-diagonal
- Adaptation: Dark blue (1.0) on diagonal, medium blue (0.6) at "Irregular" intersection
- Irregular: Dark blue (1.0) on diagonal, medium blue (0.6) at "Adaptation" and "Tonic" intersections
- Tonic: Dark blue (1.0) on diagonal, light green (0.2–0.4) off-diagonal
- **Spatial Grounding:** Darkest cells (1.0) form a diagonal from top-left to bottom-right
### Key Observations
1. **Line Graph:**
- Training accuracy surpasses testing accuracy by ~5% consistently
- Both metrics plateau at ~90% after initial epoch
2. **Heatmap:**
- Diagonal dominance suggests strong self-correlation
- "Adaptation-Irregular" and "Irregular-Tonic" show moderate correlation (0.6)
- Off-diagonal values cluster between 0.2–0.6
### Interpretation
The line graph reveals that model performance stabilizes after the first epoch, with training accuracy maintaining a slight edge over testing. The heatmap's diagonal dominance implies that categorical relationships (e.g., "Burst-Burst") exhibit maximum correlation, while cross-category interactions show diminishing returns. The "Adaptation-Irregular" and "Irregular-Tonic" moderate correlations (0.6) suggest potential for improved cross-category generalization. The consistent 5% gap between training and testing accuracy may indicate overfitting or data distribution mismatch.