## Charts: Generalization Error, M11, Q11, and Q22 vs. Training Time
### Overview
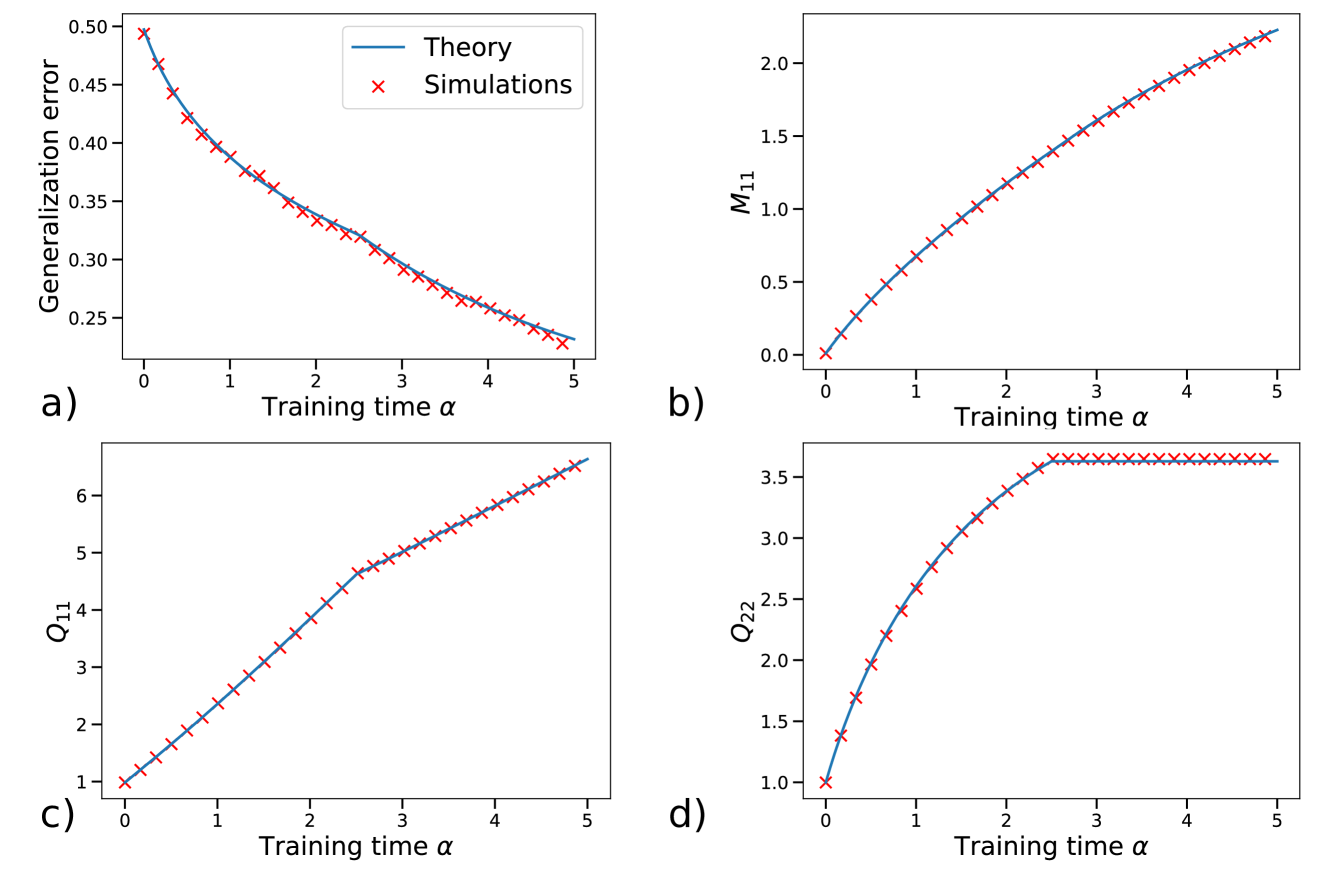
The image contains four separate charts (labeled a, b, c, and d) displaying relationships between "Training time α" and various metrics: "Generalization error", "M11", "Q11", and "Q22". Each chart plots data from both a theoretical model (represented by a solid line) and simulations (represented by red 'x' markers). All charts share the same x-axis scale.
### Components/Axes
* **X-axis (all charts):** "Training time α", ranging from approximately 0 to 5.
* **Chart a:**
* **Y-axis:** "Generalization error", ranging from approximately 0.2 to 0.5.
* **Legend:**
* Blue solid line: "Theory"
* Red 'x' markers: "Simulations"
* **Chart b:**
* **Y-axis:** "M11", ranging from approximately 0 to 2.1.
* **Legend:**
* Blue solid line: "Theory"
* Red 'x' markers: "Simulations"
* **Chart c:**
* **Y-axis:** "Q11", ranging from approximately 0 to 7.
* **Legend:**
* Blue solid line: "Theory"
* Red 'x' markers: "Simulations"
* **Chart d:**
* **Y-axis:** "Q22", ranging from approximately 0.8 to 3.6.
* **Legend:**
* Blue solid line: "Theory"
* Red 'x' markers: "Simulations"
### Detailed Analysis
**Chart a: Generalization Error vs. Training Time**
The blue "Theory" line slopes downward, indicating that as training time increases, the theoretical generalization error decreases. The red "Simulations" markers also show a downward trend, closely following the theoretical line.
* At α = 0, Generalization error (Theory) ≈ 0.48, (Simulations) ≈ 0.48
* At α = 1, Generalization error (Theory) ≈ 0.40, (Simulations) ≈ 0.38
* At α = 2, Generalization error (Theory) ≈ 0.33, (Simulations) ≈ 0.31
* At α = 3, Generalization error (Theory) ≈ 0.28, (Simulations) ≈ 0.26
* At α = 4, Generalization error (Theory) ≈ 0.25, (Simulations) ≈ 0.23
* At α = 5, Generalization error (Theory) ≈ 0.23, (Simulations) ≈ 0.21
**Chart b: M11 vs. Training Time**
The blue "Theory" line slopes upward, indicating that as training time increases, the theoretical M11 value increases. The red "Simulations" markers also show an upward trend, closely following the theoretical line.
* At α = 0, M11 (Theory) ≈ 0.0, (Simulations) ≈ 0.0
* At α = 1, M11 (Theory) ≈ 0.4, (Simulations) ≈ 0.4
* At α = 2, M11 (Theory) ≈ 0.9, (Simulations) ≈ 0.8
* At α = 3, M11 (Theory) ≈ 1.4, (Simulations) ≈ 1.3
* At α = 4, M11 (Theory) ≈ 1.8, (Simulations) ≈ 1.7
* At α = 5, M11 (Theory) ≈ 2.0, (Simulations) ≈ 1.9
**Chart c: Q11 vs. Training Time**
The blue "Theory" line slopes upward, indicating that as training time increases, the theoretical Q11 value increases. The red "Simulations" markers also show an upward trend, closely following the theoretical line.
* At α = 0, Q11 (Theory) ≈ 0.5, (Simulations) ≈ 0.5
* At α = 1, Q11 (Theory) ≈ 2.0, (Simulations) ≈ 1.8
* At α = 2, Q11 (Theory) ≈ 3.5, (Simulations) ≈ 3.3
* At α = 3, Q11 (Theory) ≈ 5.0, (Simulations) ≈ 4.8
* At α = 4, Q11 (Theory) ≈ 6.0, (Simulations) ≈ 5.8
* At α = 5, Q11 (Theory) ≈ 6.5, (Simulations) ≈ 6.3
**Chart d: Q22 vs. Training Time**
The blue "Theory" line slopes upward, indicating that as training time increases, the theoretical Q22 value increases. The red "Simulations" markers also show an upward trend, closely following the theoretical line.
* At α = 0, Q22 (Theory) ≈ 1.0, (Simulations) ≈ 1.0
* At α = 1, Q22 (Theory) ≈ 1.8, (Simulations) ≈ 1.7
* At α = 2, Q22 (Theory) ≈ 2.5, (Simulations) ≈ 2.4
* At α = 3, Q22 (Theory) ≈ 3.0, (Simulations) ≈ 2.9
* At α = 4, Q22 (Theory) ≈ 3.3, (Simulations) ≈ 3.2
* At α = 5, Q22 (Theory) ≈ 3.5, (Simulations) ≈ 3.4
### Key Observations
* In all four charts, the "Theory" and "Simulations" data closely align, suggesting the theoretical model accurately predicts the behavior observed in the simulations.
* Generalization error decreases with increasing training time (Chart a).
* M11, Q11, and Q22 all increase with increasing training time (Charts b, c, and d).
* The rate of increase appears to diminish for M11, Q11, and Q22 as training time increases, suggesting a potential saturation effect.
### Interpretation
The data suggests a learning process where increased training time leads to improved generalization performance (lower error) and changes in the model's internal parameters (M11, Q11, Q22). The close agreement between theory and simulations indicates a strong understanding of the underlying dynamics. The diminishing rate of increase in M11, Q11, and Q22 could indicate that the model is approaching a stable state or that further training provides diminishing returns. These charts likely represent the behavior of a machine learning model during training, where α represents the training iterations or epochs. The parameters M11, Q11, and Q22 could represent internal state variables or metrics related to the model's learning process. The consistent relationship between the theoretical predictions and the simulation results suggests the model is behaving as expected, and the observed trends provide insights into its learning dynamics.