## Line Graph: Accuracy vs. Compute (exaFLOP)
### Overview
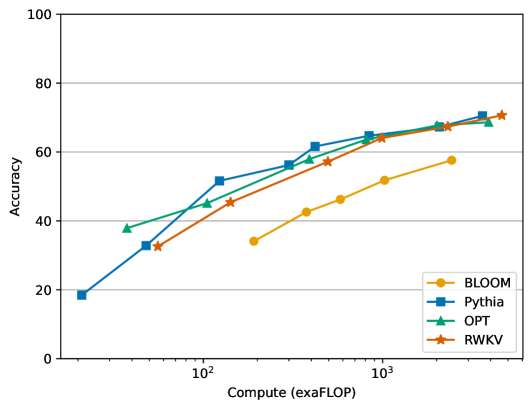
The image is a line graph comparing the accuracy of four computational models (BLOOM, Pythia, OPT, RWKV) as a function of computational resources (exaFLOPs). The x-axis represents compute in exaFLOPs on a logarithmic scale (10² to 10³), and the y-axis represents accuracy as a percentage (0–100). All four models show upward trends, with accuracy increasing as compute increases. The graph includes a legend in the bottom-right corner to distinguish the models by color and marker.
---
### Components/Axes
- **X-axis (Horizontal)**:
- Label: "Compute (exaFLOP)"
- Scale: Logarithmic (10² to 10³)
- Tick marks: 10², 10³
- **Y-axis (Vertical)**:
- Label: "Accuracy"
- Scale: Linear (0–100)
- Tick marks: 0, 20, 40, 60, 80, 100
- **Legend**:
- Position: Bottom-right corner
- Entries:
- **BLOOM**: Orange circles
- **Pythia**: Blue squares
- **OPT**: Green triangles
- **RWKV**: Red stars
---
### Detailed Analysis
1. **BLOOM (Orange Circles)**:
- Starts at ~30 exaFLOPs with ~30% accuracy.
- Increases to ~60 exaFLOPs at ~60% accuracy.
- Slope: Moderate upward trend.
2. **Pythia (Blue Squares)**:
- Starts at ~20 exaFLOPs with ~20% accuracy.
- Rises sharply to ~70 exaFLOPs at ~70% accuracy.
- Slope: Steepest among all models.
3. **OPT (Green Triangles)**:
- Starts at ~40 exaFLOPs with ~40% accuracy.
- Increases to ~70 exaFLOPs at ~70% accuracy.
- Slope: Moderate upward trend.
4. **RWKV (Red Stars)**:
- Starts at ~50 exaFLOPs with ~50% accuracy.
- Rises to ~70 exaFLOPs at ~70% accuracy.
- Slope: Steeper than BLOOM and OPT but less than Pythia.
All lines converge near 70% accuracy at 10³ exaFLOPs, suggesting diminishing returns at higher compute levels.
---
### Key Observations
- **Universal Trend**: All models improve accuracy with increased compute, but efficiency varies.
- **Efficiency Differences**:
- Pythia achieves the highest accuracy at the lowest compute (~70% at ~70 exaFLOPs).
- BLOOM and OPT require more compute to reach similar accuracy levels.
- **Convergence**: At 10³ exaFLOPs, all models plateau near 70% accuracy, indicating diminishing returns.
- **Logarithmic Scale Impact**: The x-axis’s logarithmic scale emphasizes performance differences at lower compute ranges (e.g., 10² vs. 10³).
---
### Interpretation
The graph demonstrates that computational efficiency is critical for model performance. Pythia and RWKV outperform BLOOM and OPT in terms of accuracy per exaFLOP, suggesting architectural or training advantages. The convergence at 10³ exaFLOPs implies that beyond a certain compute threshold, further resource investment yields minimal accuracy gains. This highlights trade-offs between resource allocation and model design, with implications for cost-effective deployment in resource-constrained environments.