\n
## Bar Chart: Domain Weights
### Overview
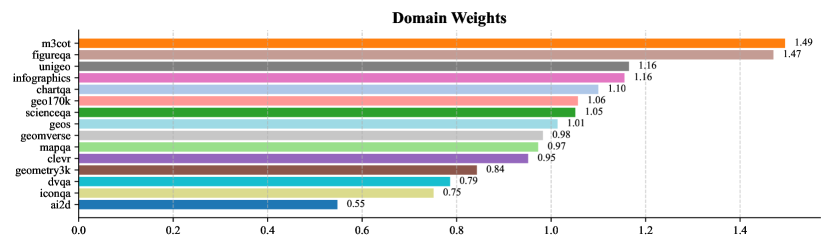
This is a horizontal bar chart displaying the weights assigned to different domains. The chart visually represents the relative importance or contribution of each domain, with longer bars indicating higher weights. The chart is titled "Domain Weights".
### Components/Axes
* **X-axis:** Represents the weight value, ranging from 0.0 to 1.5. The axis is labeled with numerical values at intervals of 0.2.
* **Y-axis:** Lists the domain names.
* **Bars:** Each bar corresponds to a domain, and its length represents the domain's weight.
* **Title:** "Domain Weights" is positioned at the top-center of the chart.
### Detailed Analysis
The chart displays the following domain weights:
* **m3cot:** Weight = 1.49 (Orange bar, longest bar)
* **figureqa:** Weight = 1.47 (Gray bar, second longest bar)
* **unigeo:** Weight = 1.16 (Gray bar)
* **infographics:** Weight = 1.16 (Gray bar)
* **chartqa:** Weight = 1.10 (Blue bar)
* **geo170k:** Weight = 1.06 (Green bar)
* **scienceqa:** Weight = 1.05 (Green bar)
* **geos:** Weight = 1.01 (Green bar)
* **geomverse:** Weight = 0.98 (Purple bar)
* **mapqa:** Weight = 0.97 (Purple bar)
* **clevr:** Weight = 0.95 (Purple bar)
* **geometry3k:** Weight = 0.84 (Purple bar)
* **dvqa:** Weight = 0.79 (Cyan bar)
* **icnqa:** Weight = 0.75 (Cyan bar)
* **road:** Weight = 0.55 (Cyan bar, shortest bar)
The bars are arranged in descending order of weight, with 'm3cot' having the highest weight and 'road' having the lowest.
### Key Observations
* 'm3cot' and 'figureqa' have significantly higher weights than the other domains, indicating their greater importance.
* The weights generally decrease as you move down the list of domains.
* There is a clear separation in weights, with a group of domains having weights around 1.1-1.2, another around 0.9-1.0, and a final group around 0.7-0.8.
### Interpretation
The chart demonstrates a clear hierarchy of domain weights. The high weights assigned to 'm3cot' and 'figureqa' suggest that these domains are crucial for the overall system or task being evaluated. The decreasing weights indicate diminishing importance of the other domains. This could be due to various factors, such as the frequency of data from each domain, the complexity of the tasks associated with each domain, or the performance of models on each domain. The chart provides valuable insights into the relative contributions of different domains and can be used to prioritize resources or focus development efforts. The large difference in weights between the top two domains and the rest suggests a potential bottleneck or area for improvement in the lower-weighted domains.