## Bar Chart: Domain Weights
### Overview
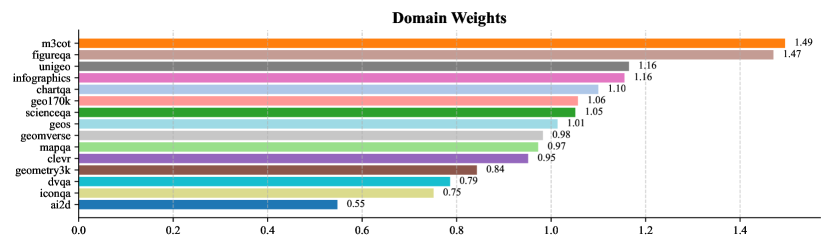
The image is a horizontal bar chart titled "Domain Weights," displaying the relative importance or usage of 15 different domains. Each domain is represented by a colored bar, with values ranging from 0.0 to 1.5 on the x-axis. The y-axis lists domain names in descending order of their weights.
### Components/Axes
- **X-axis**: Labeled "0.0" to "1.5" with increments of 0.2. Represents domain weights.
- **Y-axis**: Lists 15 domains in descending order of weight:
1. m3cot
2. figureqa
3. unigeo
4. infographics
5. chartqa
6. geo170k
7. scienceqa
8. geos
9. geomverse
10. mapqa
11. clever
12. geometry3k
13. dvqa
14. iconqa
15. ai2d
- **Colors**: Each domain is assigned a distinct color (e.g., orange for m3cot, brown for figureqa, gray for unigeo, etc.). No explicit legend is present, but colors align with the y-axis order.
### Detailed Analysis
- **m3cot**: Orange bar, weight = **1.49** (highest).
- **figureqa**: Brown bar, weight = **1.47**.
- **unigeo**: Gray bar, weight = **1.16**.
- **infographics**: Pink bar, weight = **1.16**.
- **chartqa**: Light blue bar, weight = **1.10**.
- **geo170k**: Red bar, weight = **1.06**.
- **scienceqa**: Green bar, weight = **1.05**.
- **geos**: Light blue bar, weight = **1.01**.
- **geomverse**: Gray bar, weight = **0.98**.
- **mapqa**: Green bar, weight = **0.97**.
- **clever**: Purple bar, weight = **0.95**.
- **geometry3k**: Brown bar, weight = **0.84**.
- **dvqa**: Cyan bar, weight = **0.79**.
- **iconqa**: Yellow bar, weight = **0.75**.
- **ai2d**: Blue bar, weight = **0.55** (lowest).
### Key Observations
1. **Top 3 Domains**: m3cot (1.49), figureqa (1.47), and unigeo/infographics (1.16) dominate, with weights significantly higher than the rest.
2. **Mid-Range Domains**: chartqa (1.10), geo170k (1.06), and scienceqa (1.05) cluster around 1.0, indicating moderate importance.
3. **Lower-Weight Domains**: ai2d (0.55) is the least weighted, followed by iconqa (0.75) and dvqa (0.79).
4. **Color Consistency**: Colors align with the y-axis order, confirming no mismatches between labels and visual representation.
### Interpretation
The chart highlights a clear hierarchy in domain weights, with m3cot and figureqa being the most critical. The top 10 domains all exceed 0.95, suggesting they are prioritized in the analyzed context (e.g., data processing, model training, or resource allocation). The sharp decline from the top 3 to the bottom 5 domains indicates a long-tail distribution, where a few domains dominate usage. The ai2d domain’s low weight (0.55) may reflect niche applicability or lower adoption. The absence of a legend implies the color-coding is intuitive or predefined, requiring careful cross-referencing with the y-axis labels for accuracy.