## Line Chart: Learning Rate Decay
### Overview
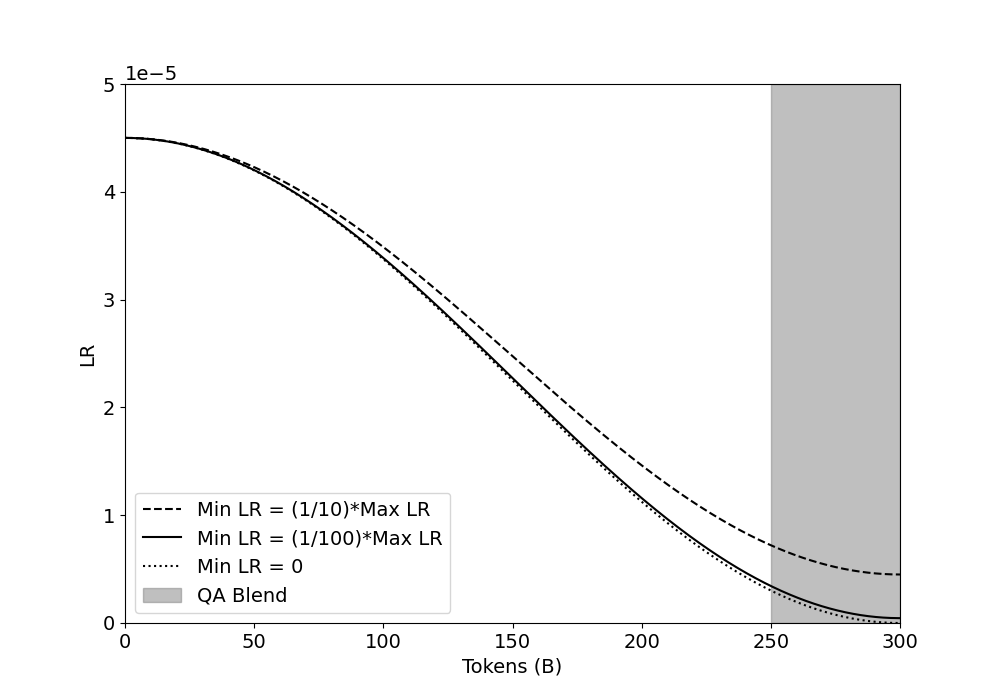
The image is a line chart illustrating the decay of the learning rate (LR) as a function of the number of tokens processed (Tokens (B)). Three different decay strategies are plotted, each corresponding to a different minimum learning rate (Min LR) relative to the maximum learning rate (Max LR). A shaded region indicates the "QA Blend" phase.
### Components/Axes
* **X-axis:** Tokens (B), ranging from 0 to 300 in increments of 50.
* **Y-axis:** LR, ranging from 0 to 5e-5.
* **Legend (bottom-left):**
* Dashed line: Min LR = (1/10)*Max LR
* Solid line: Min LR = (1/100)*Max LR
* Dotted line: Min LR = 0
* Gray shaded region: QA Blend
### Detailed Analysis
* **Min LR = (1/10)*Max LR (Dashed Line):**
* Starts at approximately 4.5e-5 at 0 Tokens.
* Decreases steadily to approximately 0.7e-5 at 250 Tokens.
* Remains relatively constant at approximately 0.5e-5 during the QA Blend phase (250-300 Tokens).
* **Min LR = (1/100)*Max LR (Solid Line):**
* Starts at approximately 4.5e-5 at 0 Tokens.
* Decreases steadily to approximately 0.2e-5 at 250 Tokens.
* Remains relatively constant at approximately 0.2e-5 during the QA Blend phase (250-300 Tokens).
* **Min LR = 0 (Dotted Line):**
* Starts at approximately 4.5e-5 at 0 Tokens.
* Decreases steadily to approximately 0.1e-5 at 250 Tokens.
* Remains relatively constant at approximately 0.1e-5 during the QA Blend phase (250-300 Tokens).
* **QA Blend (Gray Shaded Region):**
* Extends from approximately 250 Tokens to 300 Tokens.
### Key Observations
* All three learning rate decay strategies start at the same initial learning rate (approximately 4.5e-5).
* The learning rate decreases more rapidly for strategies with lower minimum learning rates.
* The QA Blend phase appears to correspond to a period where the learning rate is held constant at its minimum value.
* The "Min LR = 0" strategy results in the lowest learning rate during the QA Blend phase.
### Interpretation
The chart demonstrates the impact of different minimum learning rate settings on the learning rate decay schedule. The data suggests that a lower minimum learning rate can lead to a more aggressive decay, potentially improving convergence or generalization performance. The QA Blend phase likely represents a fine-tuning stage where the model is trained on a specific question-answering task, and the constant learning rate allows for stable optimization. The choice of minimum learning rate should be carefully considered based on the specific task and dataset.