\n
## Line Chart: Learning Rate vs. Tokens
### Overview
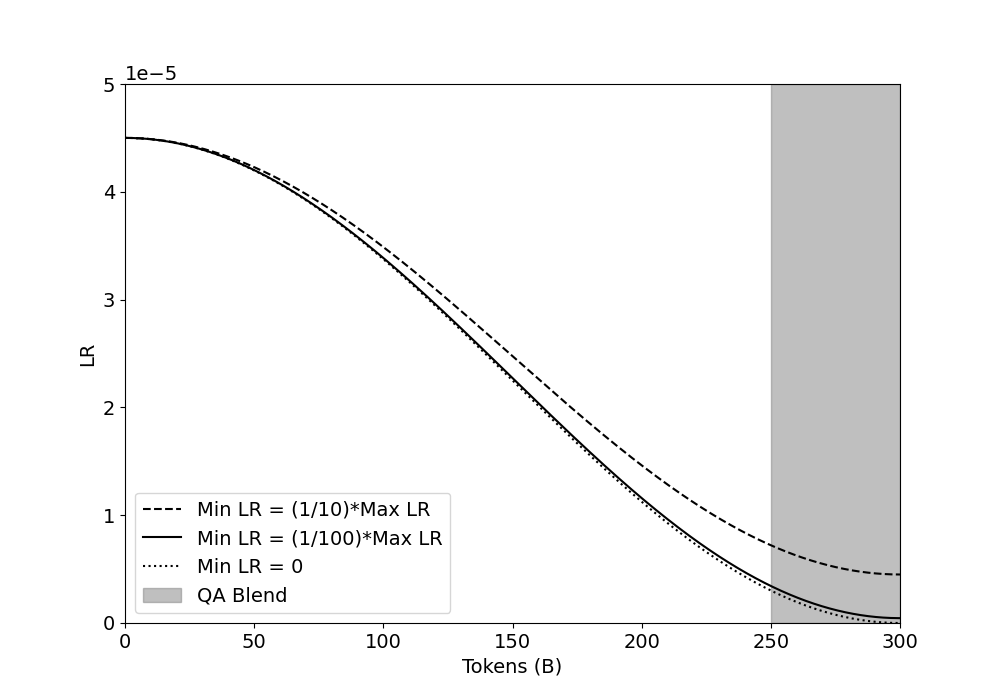
This line chart depicts the relationship between Learning Rate (LR) and Tokens (in billions, denoted as 'B') for different learning rate schedules. The chart visualizes three distinct learning rate decay strategies: a schedule where the minimum learning rate is 1/10th of the maximum learning rate, a schedule where the minimum learning rate is 1/100th of the maximum learning rate, a schedule where the minimum learning rate is zero, and a QA Blend. A shaded gray region indicates a range of tokens where the QA Blend is applied.
### Components/Axes
* **X-axis:** Tokens (B) - Scale ranges from 0 to 300, with tick marks at 50, 100, 150, 200, 250, and 300.
* **Y-axis:** LR (Learning Rate) - Scale ranges from 0 to 5e-5 (0.00005), with tick marks at 0, 1, 2, 3, 4, and 5e-5.
* **Legend:** Located in the bottom-left corner.
* "Min LR = (1/10)\*Max LR" - Represented by a dashed black line.
* "Min LR = (1/100)\*Max LR" - Represented by a solid black line.
* "Min LR = 0" - Represented by a dotted black line.
* "QA Blend" - Represented by a light gray shaded region.
### Detailed Analysis
* **Min LR = (1/10)\*Max LR (Dashed Line):** The line starts at approximately 4.3e-5 at 0 Tokens. It steadily declines, reaching approximately 0.8e-5 at 300 Tokens. The decline appears roughly exponential.
* **Min LR = (1/100)\*Max LR (Solid Line):** The line begins at approximately 4.3e-5 at 0 Tokens. It declines more rapidly than the dashed line, reaching approximately 0.4e-5 at 300 Tokens. The decline also appears roughly exponential.
* **Min LR = 0 (Dotted Line):** The line starts at approximately 4.3e-5 at 0 Tokens. It declines most rapidly of the three lines, reaching approximately 0.2e-5 at 300 Tokens. The decline is also roughly exponential.
* **QA Blend (Gray Region):** The shaded region begins at approximately 250 Tokens and extends to 300 Tokens. Within this region, the learning rate is not explicitly defined by a line, but is implied to be a blend of the other learning rate schedules. The height of the region is not precisely defined, but it appears to encompass the lower range of the learning rates.
### Key Observations
* All three learning rate decay schedules result in a decreasing learning rate as the number of tokens increases.
* The learning rate decay is most aggressive when the minimum learning rate is set to 0.
* The QA Blend is applied towards the end of the training process (between 250 and 300 billion tokens).
* The initial learning rates for all three schedules are approximately equal.
### Interpretation
The chart demonstrates different strategies for decaying the learning rate during training, likely for a large language model. The purpose of learning rate decay is to allow for larger initial steps during training, enabling faster convergence, and then smaller steps later on to fine-tune the model and prevent overshooting the optimal parameters. The QA Blend suggests a specific strategy for the final stages of training, potentially incorporating quality assurance or stabilization techniques. The choice of minimum learning rate impacts the speed and stability of the decay. A minimum learning rate of 0 results in the fastest decay, while a higher minimum learning rate (1/10 or 1/100 of the maximum) provides a more gradual decay. The application of the QA Blend at the end of training suggests a focus on refining the model's performance and ensuring its robustness. The exponential decay pattern is common in training large models, as it allows for efficient exploration of the parameter space early on and precise adjustments later.