\n
## Line Chart: Learning Rate Decay Schedule Over Training Tokens
### Overview
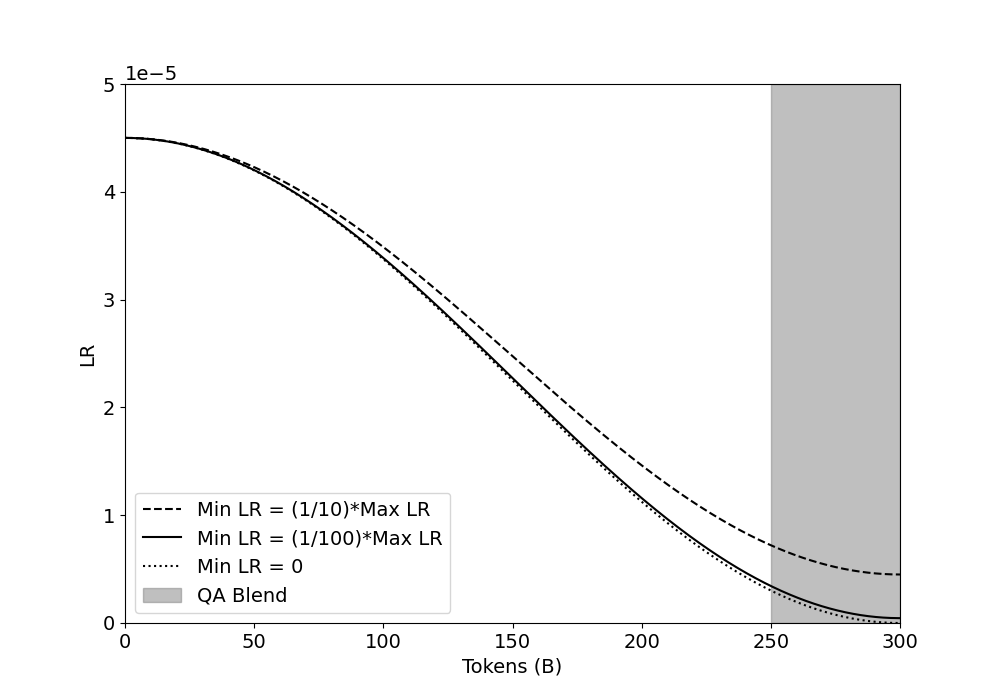
The image is a line chart illustrating three different learning rate (LR) decay schedules over the course of training a machine learning model, measured in billions of tokens. A shaded region on the right side of the chart indicates a specific training phase called "QA Blend." The chart demonstrates how the learning rate decreases from an initial maximum value as training progresses, with the rate of decay determined by the chosen minimum learning rate (Min LR) parameter.
### Components/Axes
* **Y-Axis:**
* **Label:** "LR" (Learning Rate).
* **Scale:** Linear scale from 0 to 5. A multiplier of `1e-5` is noted at the top of the axis, meaning all y-axis values should be multiplied by 0.00001. Therefore, the visible range is from 0 to 0.00005.
* **Ticks:** Major ticks are present at 0, 1, 2, 3, 4, and 5 (representing 0, 1e-5, 2e-5, 3e-5, 4e-5, and 5e-5).
* **X-Axis:**
* **Label:** "Tokens (B)" (Billions of Tokens).
* **Scale:** Linear scale from 0 to 300.
* **Ticks:** Major ticks are present at 0, 50, 100, 150, 200, 250, and 300.
* **Legend (Bottom-Left Corner):**
* **Dashed Line (`---`):** "Min LR = (1/10)*Max LR"
* **Solid Line (`—`):** "Min LR = (1/100)*Max LR"
* **Dotted Line (`····`):** "Min LR = 0"
* **Gray Shaded Box:** "QA Blend"
* **Shaded Region:**
* A vertical gray band spans the x-axis from 250B to 300B tokens, corresponding to the "QA Blend" phase.
### Detailed Analysis
* **Initial State (0 Tokens):** All three decay schedules begin at the same point. The initial learning rate (Max LR) is approximately **4.5e-5** (or 0.000045).
* **Data Series Trends & Points:**
1. **Dashed Line (Min LR = 1/10 * Max LR):**
* **Trend:** This line shows the slowest decay. It slopes downward gradually, maintaining a higher learning rate for longer compared to the other schedules.
* **Approximate Data Points:** Starts at ~4.5e-5 (0B). At 150B tokens, it is at ~2.5e-5. At 250B tokens (start of QA Blend), it is at ~0.8e-5. It ends at 300B tokens at approximately **0.5e-5**.
2. **Solid Line (Min LR = 1/100 * Max LR):**
* **Trend:** This line shows a moderate decay rate. It follows a smooth, convex curve downward.
* **Approximate Data Points:** Starts at ~4.5e-5 (0B). At 150B tokens, it is at ~2.0e-5. At 250B tokens, it is at ~0.3e-5. It approaches very close to zero by 300B tokens, approximately **0.05e-5**.
3. **Dotted Line (Min LR = 0):**
* **Trend:** This line shows the fastest decay. It has the steepest initial slope and reaches near-zero earliest.
* **Approximate Data Points:** Starts at ~4.5e-5 (0B). At 150B tokens, it is at ~1.8e-5. It crosses below the solid line around 200B tokens. It reaches approximately **0** by 300B tokens.
* **QA Blend Phase (250B - 300B Tokens):** This shaded region highlights the final 50 billion tokens of training. During this phase, all three learning rate schedules are in their final, low-value stages, with the dashed line schedule still having a notably higher LR than the other two.
### Key Observations
* All three schedules share the same starting learning rate (~4.5e-5).
* The decay curves diverge significantly after approximately 50B tokens, with the `Min LR = 0` schedule decaying the fastest and the `Min LR = (1/10)*Max LR` schedule decaying the slowest.
* The "QA Blend" phase occurs entirely within the tail end of the learning rate decay, where LRs are less than 20% of their initial value for all schedules.
* The solid and dotted lines are very close together from 0B to ~200B tokens, after which the dotted line (Min LR=0) drops below the solid line.
### Interpretation
This chart visualizes a critical hyperparameter decision in training large language models: the learning rate schedule. The data suggests that setting a non-zero minimum learning rate (e.g., 1/10th or 1/100th of the max) prevents the learning rate from vanishing completely, which can be important for continued learning or fine-tuning in later stages.
The "QA Blend" region indicates a common practice where the training data mixture is changed towards the end of training, often to specialize the model on question-answering tasks. The chart shows that this specialization phase is conducted with a very low, but potentially non-zero, learning rate. This allows the model to adapt to the new data without drastically altering the knowledge it has already acquired during the main training phase (0-250B tokens).
The choice between the three schedules represents a trade-off: a higher minimum LR (dashed line) may allow for more adaptation late in training but risks destabilizing previously learned information. A minimum LR of zero (dotted line) ensures training fully concludes but may limit late-stage adaptation. The solid line represents a middle ground. The optimal choice likely depends on the specific model architecture and training objectives.