## Line Graph: Learning Rate (LR) vs. Tokens (B) with QA Blend
### Overview
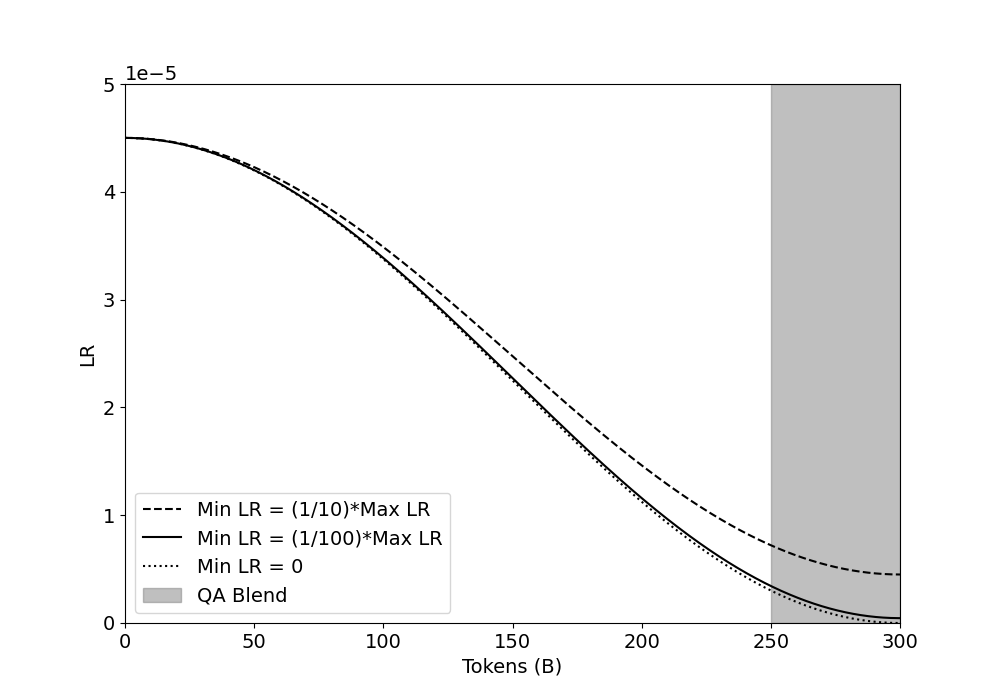
The image is a line graph depicting the relationship between Learning Rate (LR) and the number of tokens (B). Three distinct lines represent different minimum learning rate (Min LR) configurations, while a shaded vertical region labeled "QA Blend" spans the rightmost portion of the graph. The y-axis (LR) ranges from 0 to 5e-5, and the x-axis (Tokens) spans 0 to 300.
---
### Components/Axes
- **Y-Axis (LR)**: Labeled "LR" with logarithmic scaling (0 to 5e-5).
- **X-Axis (Tokens)**: Labeled "Tokens (B)" with linear scaling (0 to 300).
- **Legend**: Located in the bottom-left corner, with three entries:
- **Dashed Line**: Min LR = (1/100)*Max LR
- **Solid Line**: Min LR = (1/1000)*Max LR
- **Dotted Line**: Min LR = 0
- **QA Blend**: A vertical gray shaded region spanning tokens 250–300.
---
### Detailed Analysis
1. **Lines**:
- **Solid Line (Min LR = 1/1000 Max LR)**:
- Starts at ~4.5e-5 LR at 0 tokens.
- Decreases steeply, reaching ~0.1e-5 at 300 tokens.
- **Dashed Line (Min LR = 1/100 Max LR)**:
- Starts at ~4.5e-5 LR at 0 tokens.
- Decreases gradually, ending at ~0.5e-5 at 300 tokens.
- **Dotted Line (Min LR = 0)**:
- Remains flat at 0 LR across all token values.
- **QA Blend**:
- A vertical gray bar from 250 to 300 tokens, overlapping all lines.
2. **Trends**:
- All three lines originate at the same high LR value (~4.5e-5) at 0 tokens.
- The solid line (1/1000) exhibits the steepest decline, suggesting a rapid reduction in LR with increasing tokens.
- The dashed line (1/100) decreases more slowly, maintaining higher LR values longer.
- The dotted line (Min LR = 0) remains constant, indicating no LR adjustment.
---
### Key Observations
- **Convergence**: All lines converge near 0 LR as tokens approach 300, except the dotted line (Min LR = 0), which stays at 0.
- **QA Blend**: The shaded region (250–300 tokens) may represent a critical range for quality assurance, where LR values are intentionally controlled.
- **Steepness**: The solid line’s sharp decline implies that Min LR = 1/1000 Max LR is more sensitive to token increases than Min LR = 1/100 Max LR.
---
### Interpretation
The graph illustrates how different Min LR configurations modulate LR decay during token processing. The QA Blend’s placement at high token values (250–300) suggests this range is significant for validation or testing, possibly requiring stable LR settings. The solid line’s rapid decay (1/1000) may prioritize early-stage learning adjustments, while the dashed line (1/100) balances gradual adaptation. The dotted line (Min LR = 0) acts as a baseline, showing no LR dependency on token count. This analysis highlights the trade-offs between learning rate sensitivity and stability in token-based models.