\n
## Bar Chart: Multimodal Model Performance Comparison
### Overview
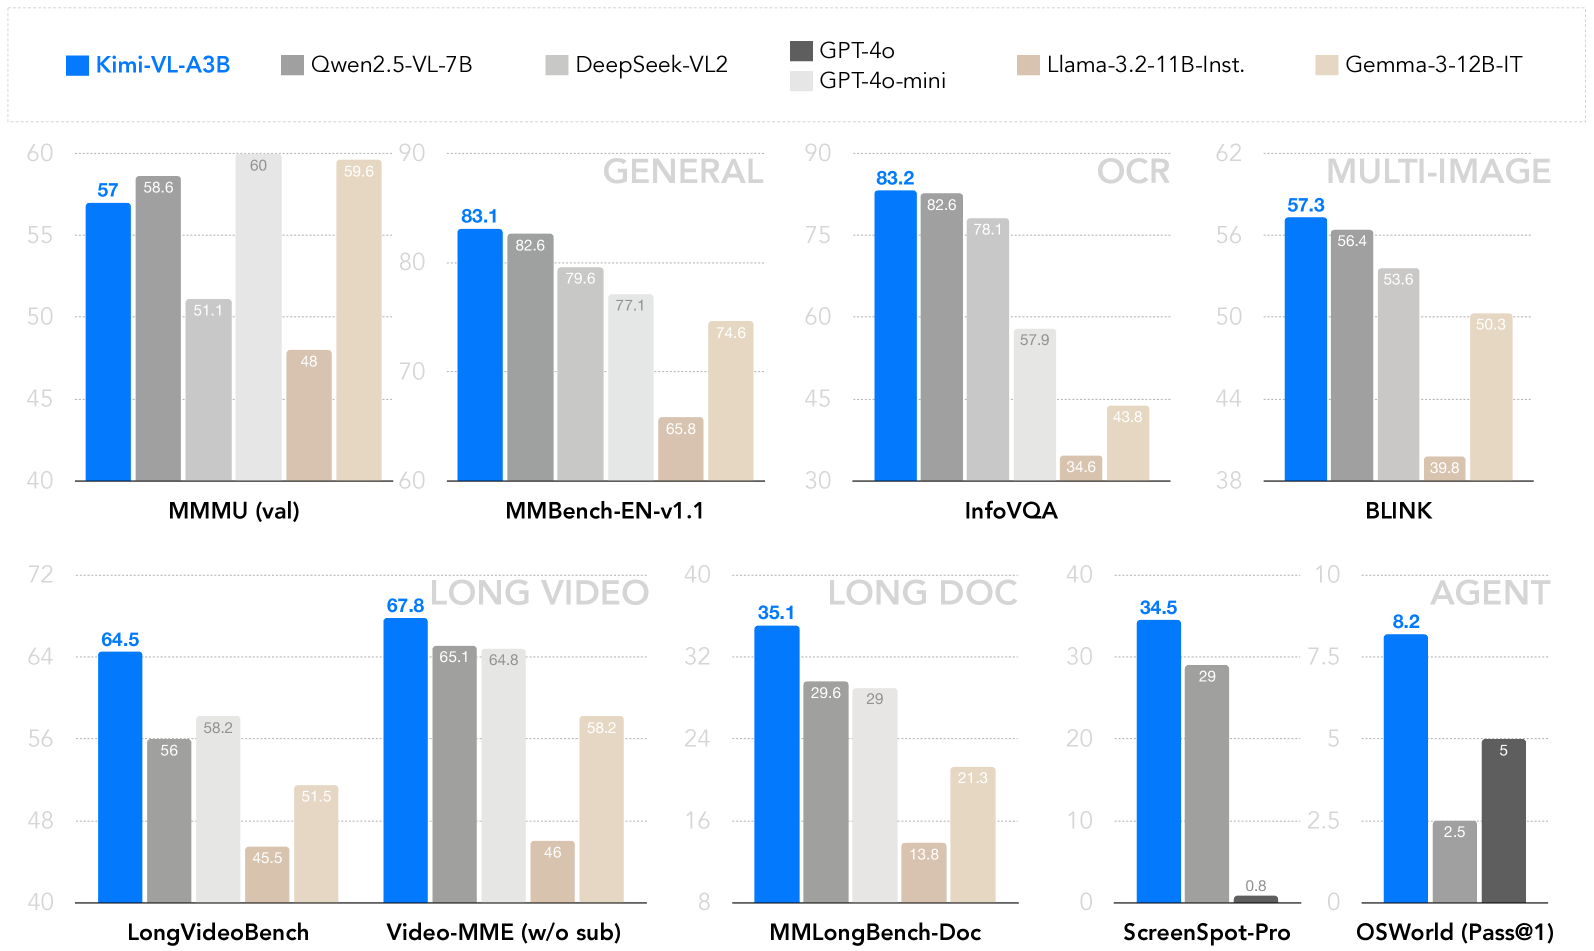
The image presents a bar chart comparing the performance of several multimodal large language models (LLMs) across various benchmark datasets. The chart displays scores for Kimi-VL-A3B, Qwen2.5-VL-7B, DeepSeek-VL2, GPT-4o/GPT-3.5-mini, Llama-3.2-11B-Inst, and Gemma-3-12B-IT on benchmarks categorized as GENERAL, OCR, MULTI-IMAGE, LONG VIDEO, LONG DOC, and AGENT.
### Components/Axes
* **X-axis:** Represents the benchmark datasets: MMU (val), MMBench-EN-v1.1, InfoVQA, BLINK, LongVideoBench, Video-MME (w/o sub), MMLongBench-Doc, ScreenSpot-Pro, OSWorld (Pass@1).
* **Y-axis:** Represents the performance score, ranging from 0 to 90 (approximately). The scale is not explicitly labeled, but can be inferred from the values displayed.
* **Legend:** Located at the top of the chart, identifies each model with a corresponding color:
* Kimi-VL-A3B (Blue)
* Qwen2.5-VL-7B (Orange)
* DeepSeek-VL2 (Gray)
* GPT-4o/GPT-3.5-mini (Green)
* Llama-3.2-11B-Inst (Purple)
* Gemma-3-12B-IT (Teal)
* **Category Headers:** "GENERAL", "OCR", "MULTI-IMAGE", "LONG VIDEO", "LONG DOC", and "AGENT" are positioned above their respective benchmark groups.
### Detailed Analysis
Here's a breakdown of the performance scores for each model on each benchmark, with approximate values:
**GENERAL**
* **MMMU (val):** Kimi-VL-A3B: 57.6, Qwen2.5-VL-7B: 51.1, DeepSeek-VL2: 60, GPT-4o/GPT-3.5-mini: 48, Llama-3.2-11B-Inst: 59.8, Gemma-3-12B-IT: ~56.
* **MMBench-EN-v1.1:** Kimi-VL-A3B: 83.1, Qwen2.5-VL-7B: 79.6, DeepSeek-VL2: 77.1, GPT-4o/GPT-3.5-mini: 74.6, Llama-3.2-11B-Inst: 82.6, Gemma-3-12B-IT: 65.8.
* **InfoVQA:** Kimi-VL-A3B: 83.2, Qwen2.5-VL-7B: 78.1, DeepSeek-VL2: 57.9, GPT-4o/GPT-3.5-mini: 43.8, Llama-3.2-11B-Inst: ~80, Gemma-3-12B-IT: 34.6.
**OCR**
* **BLINK:** Kimi-VL-A3B: 57.3, Qwen2.5-VL-7B: 56.4, DeepSeek-VL2: 53.6, GPT-4o/GPT-3.5-mini: 39.8, Llama-3.2-11B-Inst: ~50.3, Gemma-3-12B-IT: ~50.
**LONG VIDEO**
* **LongVideoBench:** Kimi-VL-A3B: 64.5, Qwen2.5-VL-7B: 58.2, DeepSeek-VL2: 51.5, GPT-4o/GPT-3.5-mini: 45.5, Llama-3.2-11B-Inst: ~60, Gemma-3-12B-IT: ~48.
* **Video-MME (w/o sub):** Kimi-VL-A3B: 67.8, Qwen2.5-VL-7B: 65.1, DeepSeek-VL2: 64.8, GPT-4o/GPT-3.5-mini: 46, Llama-3.2-11B-Inst: ~60, Gemma-3-12B-IT: ~50.
**LONG DOC**
* **MMLongBench-Doc:** Kimi-VL-A3B: 35.1, Qwen2.5-VL-7B: 29.6, DeepSeek-VL2: 29, GPT-4o/GPT-3.5-mini: 21.3, Llama-3.2-11B-Inst: 13.8, Gemma-3-12B-IT: ~20.
**AGENT**
* **ScreenSpot-Pro:** Kimi-VL-A3B: 34.5, Qwen2.5-VL-7B: 29, DeepSeek-VL2: ~10, GPT-4o/GPT-3.5-mini: ~10, Llama-3.2-11B-Inst: ~20, Gemma-3-12B-IT: 0.8.
* **OSWorld (Pass@1):** Kimi-VL-A3B: 8.2, Qwen2.5-VL-7B: 5, DeepSeek-VL2: 5, GPT-4o/GPT-3.5-mini: 2.5, Llama-3.2-11B-Inst: ~5, Gemma-3-12B-IT: ~2.5.
### Key Observations
* **Kimi-VL-A3B** consistently performs well across most benchmarks, often achieving the highest scores.
* **Qwen2.5-VL-7B** generally performs second best, but lags behind Kimi-VL-A3B.
* **DeepSeek-VL2** shows moderate performance, generally falling in the middle range.
* **GPT-4o/GPT-3.5-mini** exhibits lower scores, particularly on the InfoVQA and LONG DOC benchmarks.
* **Llama-3.2-11B-Inst** shows variable performance, with strong results on some benchmarks (MMBench-EN-v1.1) and weaker results on others (MMLongBench-Doc).
* **Gemma-3-12B-IT** consistently shows the lowest performance across most benchmarks.
* The performance gap between models is most pronounced on the LONG DOC and AGENT benchmarks.
### Interpretation
The chart demonstrates a clear hierarchy in the performance of these multimodal LLMs. Kimi-VL-A3B emerges as the leading model, excelling in a broad range of tasks. The results suggest that model architecture, training data, and model size all contribute to performance differences. The lower scores on LONG DOC and AGENT benchmarks may indicate challenges in processing long-form content or complex reasoning tasks. The significant performance gap between models highlights the ongoing research and development efforts in the field of multimodal AI. The data suggests that while progress has been made, there is still considerable room for improvement, particularly in areas requiring advanced reasoning and long-context understanding. The variation in performance across different benchmarks also suggests that no single model is universally superior; the optimal choice depends on the specific application and requirements.