## Stacked Bar Chart: Self-Rewarding Model Comparison
### Overview
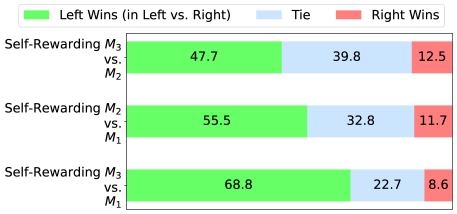
The image is a stacked bar chart comparing the performance of different self-rewarding models (M1, M2, and M3) in a pairwise competition. The chart shows the percentage of wins for the "Left" model, the percentage of ties, and the percentage of wins for the "Right" model in each comparison. The models are compared in the following pairs: M3 vs. M2, M2 vs. M1, and M3 vs. M1.
### Components/Axes
* **Title:** There is no explicit title, but the chart compares "Self-Rewarding" models.
* **Y-axis:** The Y-axis represents the model comparisons. The labels are:
* Self-Rewarding M3 vs. M2
* Self-Rewarding M2 vs. M1
* Self-Rewarding M3 vs. M1
* **X-axis:** The X-axis represents the percentage of outcomes (wins and ties).
* **Legend:** Located at the top of the chart.
* Green: Left Wins (in Left vs. Right)
* Light Blue: Tie
* Red: Right Wins
### Detailed Analysis
The chart presents three stacked horizontal bars, each representing a comparison between two models. The length of each segment within a bar corresponds to the percentage of wins or ties for that outcome.
* **Self-Rewarding M3 vs. M2:**
* Left Wins (M3): 47.7% (Green)
* Tie: 39.8% (Light Blue)
* Right Wins (M2): 12.5% (Red)
* **Self-Rewarding M2 vs. M1:**
* Left Wins (M2): 55.5% (Green)
* Tie: 32.8% (Light Blue)
* Right Wins (M1): 11.7% (Red)
* **Self-Rewarding M3 vs. M1:**
* Left Wins (M3): 68.8% (Green)
* Tie: 22.7% (Light Blue)
* Right Wins (M1): 8.6% (Red)
### Key Observations
* M3 performs better than M2, with 47.7% wins compared to M2's 12.5% wins.
* M2 performs better than M1, with 55.5% wins compared to M1's 11.7% wins.
* M3 performs significantly better than M1, with 68.8% wins compared to M1's 8.6% wins.
* The percentage of ties varies between the comparisons, with M3 vs. M2 having the highest tie rate (39.8%) and M3 vs. M1 having the lowest (22.7%).
### Interpretation
The chart demonstrates the relative performance of three self-rewarding models. M3 consistently outperforms M1 and M2, suggesting it is the most effective model among the three. M2 also outperforms M1. The tie rates indicate the degree of similarity in performance between the models being compared. The lower the tie rate, the more distinct the performance difference between the two models. The data suggests a hierarchy of performance: M3 > M2 > M1.