# Technical Data Extraction: Model Comparison Horizontal Stacked Bar Chart
## 1. Component Isolation
* **Header/Legend Region:** Located at the top of the image. Contains color-coded keys for data interpretation.
* **Main Chart Region:** Contains three horizontal stacked bars representing head-to-head model comparisons.
* **Y-Axis (Labels):** Located on the left, identifying the specific models being compared.
* **Data Labels:** Numerical values embedded within each colored segment of the bars.
## 2. Legend and Color Mapping
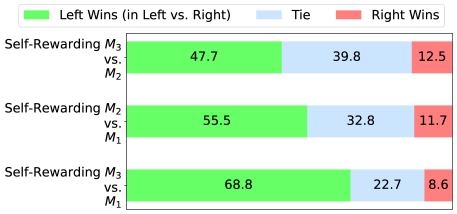
The legend is positioned at the top of the chart.
| Color | Label | Meaning |
| :--- | :--- | :--- |
| **Green** | Left Wins (in Left vs. Right) | The first model listed in the Y-axis label outperformed the second. |
| **Light Blue** | Tie | No significant difference or a neutral result between models. |
| **Red/Salmon** | Right Wins | The second model listed in the Y-axis label outperformed the first. |
## 3. Data Table Extraction
The chart displays three distinct comparisons. Each bar represents 100% of the total outcomes.
| Comparison (Y-Axis Label) | Left Wins (Green) | Tie (Blue) | Right Wins (Red) |
| :--- | :---: | :---: | :---: |
| **Self-Rewarding $M_3$ vs. $M_2$** | 47.7 | 39.8 | 12.5 |
| **Self-Rewarding $M_2$ vs. $M_1$** | 55.5 | 32.8 | 11.7 |
| **Self-Rewarding $M_3$ vs. $M_1$** | 68.8 | 22.7 | 8.6 |
## 4. Trend Analysis and Observations
* **Dominance of "Left" Models:** In all three scenarios, the model listed first (the "Left" model) significantly outperforms the model listed second (the "Right" model). The green segment is the largest in every bar.
* **Iterative Improvement:**
* $M_2$ shows a clear win rate of 55.5% over $M_1$.
* $M_3$ shows a win rate of 47.7% over $M_2$.
* The most significant performance gap is seen in the **$M_3$ vs. $M_1$** comparison, where $M_3$ achieves its highest win rate (68.8%) and the lowest loss rate (8.6%).
* **Tie Frequency:** The frequency of ties decreases as the performance gap between models increases. The highest tie rate (39.8%) occurs between the most recent iterations ($M_3$ vs. $M_2$), while the lowest tie rate (22.7%) occurs between the most distant iterations ($M_3$ vs. $M_1$).
* **Visual Trend:** As you move from the top bar to the bottom bar, the green segment expands significantly to the right, while the blue and red segments shrink, indicating that $M_3$ is a substantial improvement over $M_1$ compared to the incremental improvements between consecutive versions.