\n
## Stacked Bar Chart: Self-Rewarding Strategy Comparisons
### Overview
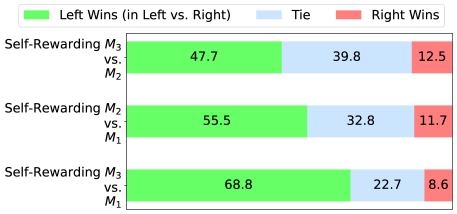
This is a stacked horizontal bar chart comparing the win rates of different self-rewarding strategies (M3 vs. M2, M2 vs. M1, and M3 vs. M1). The chart displays the percentage of wins for the "Left" side, "Ties", and "Right" side for each strategy comparison.
### Components/Axes
* **Y-axis:** Lists the strategy comparisons: "Self-Rewarding M3 vs. M2", "Self-Rewarding M2 vs. M1", and "Self-Rewarding M3 vs. M1".
* **X-axis:** Represents the percentage of wins, ranging from approximately 0% to 70%. No explicit scale is provided, but the values suggest a linear scale.
* **Legend (Top-Left):**
* Green: "Left Wins (in Left vs. Right)"
* Light Blue: "Tie"
* Red: "Right Wins"
### Detailed Analysis
The chart consists of three stacked horizontal bars, one for each strategy comparison. Each bar is divided into three segments representing the percentage of Left Wins, Ties, and Right Wins.
1. **Self-Rewarding M3 vs. M2:**
* Left Wins (Green): 47.7%
* Tie (Light Blue): 39.8%
* Right Wins (Red): 12.5%
2. **Self-Rewarding M2 vs. M1:**
* Left Wins (Green): 55.5%
* Tie (Light Blue): 32.8%
* Right Wins (Red): 11.7%
3. **Self-Rewarding M3 vs. M1:**
* Left Wins (Green): 68.8%
* Tie (Light Blue): 22.7%
* Right Wins (Red): 8.6%
### Key Observations
* The "Left Wins" percentage increases as the strategy comparison moves down the chart (M3 vs. M2 < M2 vs. M1 < M3 vs. M1).
* The "Right Wins" percentage decreases as the strategy comparison moves down the chart.
* The "Tie" percentage is relatively stable, fluctuating between 22.7% and 39.8%.
* M3 vs. M1 has the highest Left Win rate (68.8%) and the lowest Right Win rate (8.6%).
### Interpretation
The data suggests that the self-rewarding strategy M3 consistently outperforms M2 and M1, particularly when compared directly to M1. The increasing "Left Wins" and decreasing "Right Wins" percentages indicate a clear advantage for M3 in these scenarios. The relatively consistent "Tie" rate suggests that the overall level of uncertainty or equal performance remains similar across the different strategy comparisons. The chart demonstrates a hierarchical relationship between the strategies, with M3 appearing to be the most effective, followed by M2, and then M1. The differences in win rates are substantial enough to suggest that the choice of strategy has a significant impact on the outcome.