# Technical Document: Bar Chart Analysis
## Chart Type
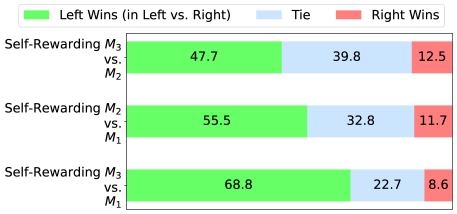
Horizontal grouped bar chart comparing performance metrics across three model comparisons.
## Legend
- **Green**: Left Wins (in Left vs. Right)
- **Blue**: Tie
- **Red**: Right Wins
## Axis Labels
- **X-Axis**: Model comparisons (categorical)
- "Self-Rewarding M₃ vs. M₂"
- "Self-Rewarding M₂ vs. M₁"
- "Self-Rewarding M₃ vs. M₁"
- **Y-Axis**: Percentage (%) (quantitative)
## Data Points
### Self-Rewarding M₃ vs. M₂
- Left Wins: 47.7%
- Tie: 39.8%
- Right Wins: 12.5%
### Self-Rewarding M₂ vs. M₁
- Left Wins: 55.5%
- Tie: 32.8%
- Right Wins: 11.7%
### Self-Rewarding M₃ vs. M₁
- Left Wins: 68.8%
- Tie: 22.7%
- Right Wins: 8.6%
## Key Trends
1. **Left Wins** consistently increase as the model comparison becomes more "left-leaning":
- M₃ vs. M₂: 47.7%
- M₂ vs. M₁: 55.5%
- M₃ vs. M₁: 68.8%
2. **Tie** rates decrease across comparisons:
- M₃ vs. M₂: 39.8%
- M₂ vs. M₁: 32.8%
- M₃ vs. M₁: 22.7%
3. **Right Wins** show a significant decline:
- M₃ vs. M₂: 12.5%
- M₂ vs. M₁: 11.7%
- M₃ vs. M₁: 8.6%
## Structural Notes
- Bars are grouped by model comparison, with each group containing three bars (green, blue, red).
- Percentages sum to 100% for each comparison (e.g., 47.7 + 39.8 + 12.5 = 100.0).
- No overlapping or missing data points observed.
## Conclusion
The chart demonstrates a clear trend where "Left Wins" dominate as the model comparison shifts toward M₃, while "Right Wins" diminish proportionally. Ties act as an intermediate metric, decreasing as model differences increase.