## Chart: Accuracy vs. Recursion Depth for Different Models
### Overview
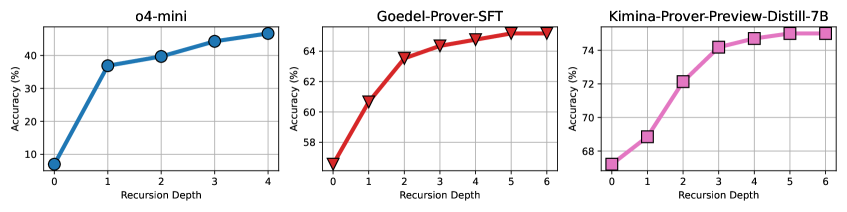
The image presents three line graphs comparing the accuracy of different models ("o4-mini", "Goedel-Prover-SFT", and "Kimina-Prover-Preview-Distill-7B") as a function of recursion depth. Each graph plots accuracy (in percentage) on the y-axis against recursion depth on the x-axis.
### Components/Axes
* **X-axis (all graphs):** Recursion Depth, with integer values from 0 to 4 (o4-mini) or 0 to 6 (Goedel-Prover-SFT and Kimina-Prover-Preview-Distill-7B).
* **Y-axis (all graphs):** Accuracy (%), with a range from approximately 0 to 50 for "o4-mini", 57 to 65 for "Goedel-Prover-SFT", and 67 to 76 for "Kimina-Prover-Preview-Distill-7B".
* **Graph Titles:**
* Left: "o4-mini"
* Middle: "Goedel-Prover-SFT"
* Right: "Kimina-Prover-Preview-Distill-7B"
* **Data Series:**
* "o4-mini": Blue line with circle markers.
* "Goedel-Prover-SFT": Red line with downward triangle markers.
* "Kimina-Prover-Preview-Distill-7B": Pink line with square markers.
### Detailed Analysis
**1. o4-mini (Left Graph):**
* **Trend:** The blue line slopes upward, indicating increasing accuracy with recursion depth.
* **Data Points:**
* Recursion Depth 0: Accuracy approximately 7%.
* Recursion Depth 1: Accuracy approximately 38%.
* Recursion Depth 2: Accuracy approximately 40%.
* Recursion Depth 3: Accuracy approximately 44%.
* Recursion Depth 4: Accuracy approximately 46%.
**2. Goedel-Prover-SFT (Middle Graph):**
* **Trend:** The red line slopes upward, with a steep initial increase, followed by a plateau.
* **Data Points:**
* Recursion Depth 0: Accuracy approximately 57%.
* Recursion Depth 1: Accuracy approximately 61%.
* Recursion Depth 2: Accuracy approximately 64%.
* Recursion Depth 3: Accuracy approximately 64.5%.
* Recursion Depth 4: Accuracy approximately 65%.
* Recursion Depth 5: Accuracy approximately 65%.
* Recursion Depth 6: Accuracy approximately 65%.
**3. Kimina-Prover-Preview-Distill-7B (Right Graph):**
* **Trend:** The pink line slopes upward, with a steep initial increase, followed by a plateau.
* **Data Points:**
* Recursion Depth 0: Accuracy approximately 67%.
* Recursion Depth 1: Accuracy approximately 69%.
* Recursion Depth 2: Accuracy approximately 72%.
* Recursion Depth 3: Accuracy approximately 74%.
* Recursion Depth 4: Accuracy approximately 74.5%.
* Recursion Depth 5: Accuracy approximately 75%.
* Recursion Depth 6: Accuracy approximately 75%.
### Key Observations
* All three models show an increase in accuracy with increasing recursion depth, but the rate of increase diminishes as recursion depth increases.
* "Kimina-Prover-Preview-Distill-7B" consistently achieves the highest accuracy across all recursion depths.
* "o4-mini" has the lowest initial accuracy and the smallest overall range of accuracy values.
* "Goedel-Prover-SFT" and "Kimina-Prover-Preview-Distill-7B" exhibit a similar trend, with a sharp initial increase in accuracy followed by a plateau.
### Interpretation
The graphs suggest that increasing recursion depth generally improves the accuracy of these models, but there are diminishing returns. The "Kimina-Prover-Preview-Distill-7B" model appears to be the most effective, achieving the highest accuracy across all recursion depths. The "o4-mini" model is the least accurate. The plateauing effect observed in "Goedel-Prover-SFT" and "Kimina-Prover-Preview-Distill-7B" indicates that there is a limit to the benefits of increasing recursion depth for these models. The data implies that the "Kimina-Prover-Preview-Distill-7B" model is the most sophisticated or well-optimized among the three, as it consistently outperforms the others.