\n
## Line Charts: Accuracy vs. Recursion Depth for Different Models
### Overview
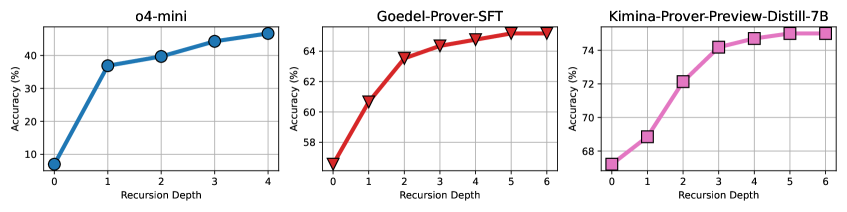
This image presents three separate line charts, each depicting the relationship between "Accuracy (%)" and "Recursion Depth" for three different models: "o4-mini", "Goedel-Prover-SFT", and "Kimina-Prover-Preview-Distill-7B". Each chart shows how accuracy changes as the recursion depth increases.
### Components/Axes
Each chart shares the same axes:
* **X-axis:** "Recursion Depth", ranging from 0 to 4 for the first chart, 0 to 6 for the second and third charts.
* **Y-axis:** "Accuracy (%)", ranging from approximately 8% to 75%.
* Each chart has a title indicating the model being evaluated.
* Each chart has a line representing the accuracy of the model at different recursion depths.
### Detailed Analysis or Content Details
**Chart 1: o4-mini**
* **Line Color:** Blue
* **Trend:** The line slopes upward, indicating increasing accuracy with increasing recursion depth, but the rate of increase slows down at higher recursion depths.
* **Data Points (approximate):**
* Recursion Depth 0: ~9%
* Recursion Depth 1: ~38%
* Recursion Depth 2: ~41%
* Recursion Depth 3: ~44%
**Chart 2: Goedel-Prover-SFT**
* **Line Color:** Red
* **Trend:** The line shows a rapid increase in accuracy initially, then plateaus as recursion depth increases.
* **Data Points (approximate):**
* Recursion Depth 0: ~58%
* Recursion Depth 1: ~60%
* Recursion Depth 2: ~62%
* Recursion Depth 3: ~63%
* Recursion Depth 4: ~64%
* Recursion Depth 5: ~64%
* Recursion Depth 6: ~64%
**Chart 3: Kimina-Prover-Preview-Distill-7B**
* **Line Color:** Purple
* **Trend:** The line slopes upward, showing increasing accuracy with increasing recursion depth. The rate of increase is more consistent than in the "o4-mini" chart.
* **Data Points (approximate):**
* Recursion Depth 0: ~68%
* Recursion Depth 1: ~70%
* Recursion Depth 2: ~72%
* Recursion Depth 3: ~73%
* Recursion Depth 4: ~74%
* Recursion Depth 5: ~74%
* Recursion Depth 6: ~75%
### Key Observations
* The "Goedel-Prover-SFT" model achieves the highest accuracy overall, plateauing around 64%.
* The "Kimina-Prover-Preview-Distill-7B" model shows a consistent increase in accuracy with recursion depth, reaching approximately 75%.
* The "o4-mini" model starts with the lowest accuracy and exhibits a diminishing return in accuracy gains as recursion depth increases.
* All models demonstrate that increasing recursion depth generally improves accuracy, although the extent of improvement varies significantly.
### Interpretation
The data suggests that recursion depth is a crucial parameter for improving the accuracy of these models. However, the optimal recursion depth varies depending on the model architecture. The "Goedel-Prover-SFT" model appears to reach its performance limit relatively quickly, while the "Kimina-Prover-Preview-Distill-7B" model continues to benefit from increased recursion depth throughout the observed range. The "o4-mini" model shows the least improvement with increasing recursion depth, indicating that its performance may be limited by other factors. The differences in performance between the models could be attributed to variations in model size, training data, or architectural design. The plateauing effect observed in the "Goedel-Prover-SFT" and "Kimina-Prover-Preview-Distill-7B" models suggests that there is a point of diminishing returns where further increasing recursion depth does not yield significant accuracy gains.