## Line Charts: Model Accuracy vs. Recursion Depth
### Overview
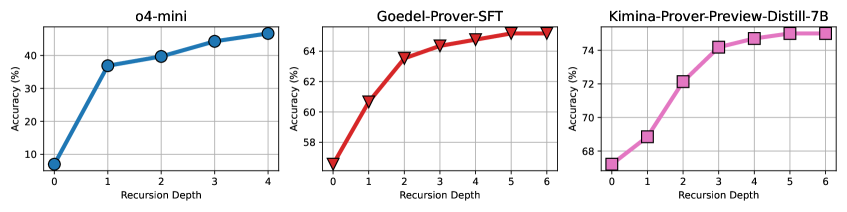
The image displays three separate line charts arranged horizontally, each plotting the accuracy of a different AI model against increasing recursion depth. The charts share the same axis labels but have different scales and data trends. All charts show a positive correlation between recursion depth and accuracy.
### Components/Axes
* **Common Elements:**
* **X-axis Label (All Charts):** "Recursion Depth"
* **Y-axis Label (All Charts):** "Accuracy (%)"
* **Chart Titles (Top-Center of each plot):** Left: "o4-mini", Middle: "Goedel-Prover-SFT", Right: "Kimina-Prover-Preview-Distill-7B"
* **Data Series:** Each chart contains a single data series represented by a colored line with distinct markers.
* **Left Chart (o4-mini):**
* **Line Color:** Blue
* **Marker Style:** Filled circles
* **X-axis Range:** 0 to 4 (integer steps)
* **Y-axis Range:** Approximately 5% to 45%
* **Middle Chart (Goedel-Prover-SFT):**
* **Line Color:** Red
* **Marker Style:** Filled downward-pointing triangles
* **X-axis Range:** 0 to 6 (integer steps)
* **Y-axis Range:** Approximately 56% to 65%
* **Right Chart (Kimina-Prover-Preview-Distill-7B):**
* **Line Color:** Magenta/Pink
* **Marker Style:** Filled squares
* **X-axis Range:** 0 to 6 (integer steps)
* **Y-axis Range:** Approximately 67% to 75%
### Detailed Analysis
**1. Left Chart: o4-mini**
* **Trend:** The line shows a steep, concave-down increase. Accuracy rises sharply from depth 0 to 1, then the rate of improvement slows but remains positive through depth 4.
* **Data Points (Approximate):**
* Depth 0: ~8%
* Depth 1: ~37%
* Depth 2: ~40%
* Depth 3: ~43%
* Depth 4: ~45%
**2. Middle Chart: Goedel-Prover-SFT**
* **Trend:** The line shows a steady, concave-down increase. The slope is steepest from depth 0 to 2 and gradually flattens, suggesting diminishing returns at higher recursion depths.
* **Data Points (Approximate):**
* Depth 0: ~56%
* Depth 1: ~61%
* Depth 2: ~63.5%
* Depth 3: ~64.5%
* Depth 4: ~65%
* Depth 5: ~65.2%
* Depth 6: ~65.3%
**3. Right Chart: Kimina-Prover-Preview-Distill-7B**
* **Trend:** The line shows a consistent, nearly linear increase with a very slight flattening at the highest depths. It demonstrates the most sustained improvement across the measured range.
* **Data Points (Approximate):**
* Depth 0: ~67%
* Depth 1: ~69%
* Depth 2: ~72%
* Depth 3: ~74%
* Depth 4: ~74.5%
* Depth 5: ~74.8%
* Depth 6: ~75%
### Key Observations
1. **Performance Hierarchy:** There is a clear hierarchy in baseline (depth 0) and peak accuracy. Kimina-Prover-Preview-Distill-7B > Goedel-Prover-SFT > o4-mini.
2. **Improvement Magnitude:** The model with the lowest starting accuracy (o4-mini) shows the largest relative gain (~37 percentage points from depth 0 to 4). The highest-performing model (Kimina-Prover-Preview-Distill-7B) shows the smallest absolute gain (~8 points from depth 0 to 6).
3. **Diminishing Returns:** All three models exhibit diminishing returns, where each additional unit of recursion depth yields a smaller increase in accuracy. This effect is most pronounced in the Goedel-Prover-SFT chart.
4. **Recursion Depth Tested:** The o4-mini model was only evaluated up to depth 4, while the other two were evaluated up to depth 6.
### Interpretation
The data demonstrates that increasing recursion depth is an effective strategy for improving the accuracy of these specific AI models on the evaluated task. The relationship is non-linear, following a pattern of rapid initial gains that taper off.
The significant differences in absolute performance suggest these are fundamentally different models or were trained/fine-tuned with different methodologies (as hinted by their names: "SFT" likely for Supervised Fine-Tuning, "Distill" for knowledge distillation). The "o4-mini" model appears to be a smaller or less capable base model that benefits dramatically from added computation (recursion), while the "Kimina-Prover-Preview-Distill-7B" starts from a much higher performance plateau.
From a Peircean perspective, the charts are **icons** representing the quantitative relationship between two variables. They are also **indices** pointing to a causal hypothesis: that recursive self-correction or refinement (the implied process behind "Recursion Depth") improves output quality. The consistent trend across three different models strengthens the argument that this is a generalizable phenomenon for this class of model and task, rather than an artifact of a single architecture. The diminishing returns are a critical practical insight, indicating there is an optimal recursion depth beyond which computational cost may outweigh marginal accuracy benefits.