# Unified QuadGraph Diagram Analysis
## Overview
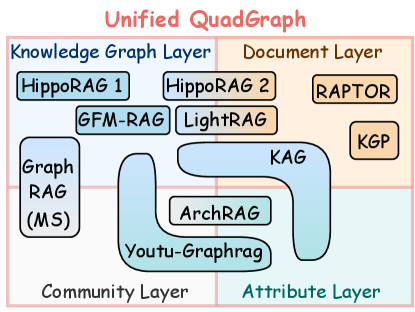
The diagram illustrates a **Unified QuadGraph** architecture divided into four interconnected layers:
1. **Knowledge Graph Layer** (top-left, blue)
2. **Document Layer** (top-right, orange)
3. **Community Layer** (bottom-left, light blue)
4. **Attribute Layer** (bottom-right, teal)
---
## Layer Breakdown
### 1. Knowledge Graph Layer (Blue)
- **HippoRAG 1**: Positioned at the top-left corner of the layer.
- **HippoRAG 2**: Adjacent to HippoRAG 1, slightly to the right.
- **GFM-RAG**: Located below HippoRAG 1, centered horizontally.
- **LightRAG**: Positioned below GFM-RAG, aligned with HippoRAG 2.
- **Graph RAG (MS)**: Large rectangular block spanning the left side of the layer.
- **KAG**: Curved block connecting the Knowledge Graph Layer to the Attribute Layer.
### 2. Document Layer (Orange)
- **RAPTOR**: Positioned at the top-right corner of the layer.
- **KGP**: Smaller block below RAPTOR, aligned to the left.
### 3. Community Layer (Light Blue)
- **Youtu-Graphrag**: Curved block spanning the bottom-left quadrant, connecting to the Knowledge Graph Layer via KAG.
### 4. Attribute Layer (Teal)
- **ArchRAG**: Positioned at the top-left corner of the layer, connected to KAG.
---
## Connections and Flow
- **KAG** acts as a bridge between the **Knowledge Graph Layer** and the **Attribute Layer**, indicating data flow or integration.
- **Youtu-Graphrag** in the Community Layer connects to KAG, suggesting cross-layer interaction.
- No explicit directional arrows are present, but spatial proximity implies relationships (e.g., KAG’s curved path).
---
## Key Observations
1. **Component Distribution**:
- Knowledge Graph Layer contains the most components (6).
- Document Layer has 2 components, while Community and Attribute Layers each have 1.
2. **Naming Conventions**:
- Most components use the "RAG" suffix (e.g., HippoRAG, LightRAG), except RAPTOR, KGP, and Youtu-Graphrag.
- "MS" in "Graph RAG (MS)" likely denotes a specific variant or module.
3. **Color Coding**:
- Layers are distinctly color-coded for easy differentiation.
- Components within layers share the layer’s dominant color with slight gradients.
---
## Notes
- No numerical data, charts, or tables are present.
- All text is in English; no translation required.
- The diagram emphasizes architectural relationships rather than quantitative trends.