## Line Chart: Performance Comparison of Problem Solving Methods
### Overview
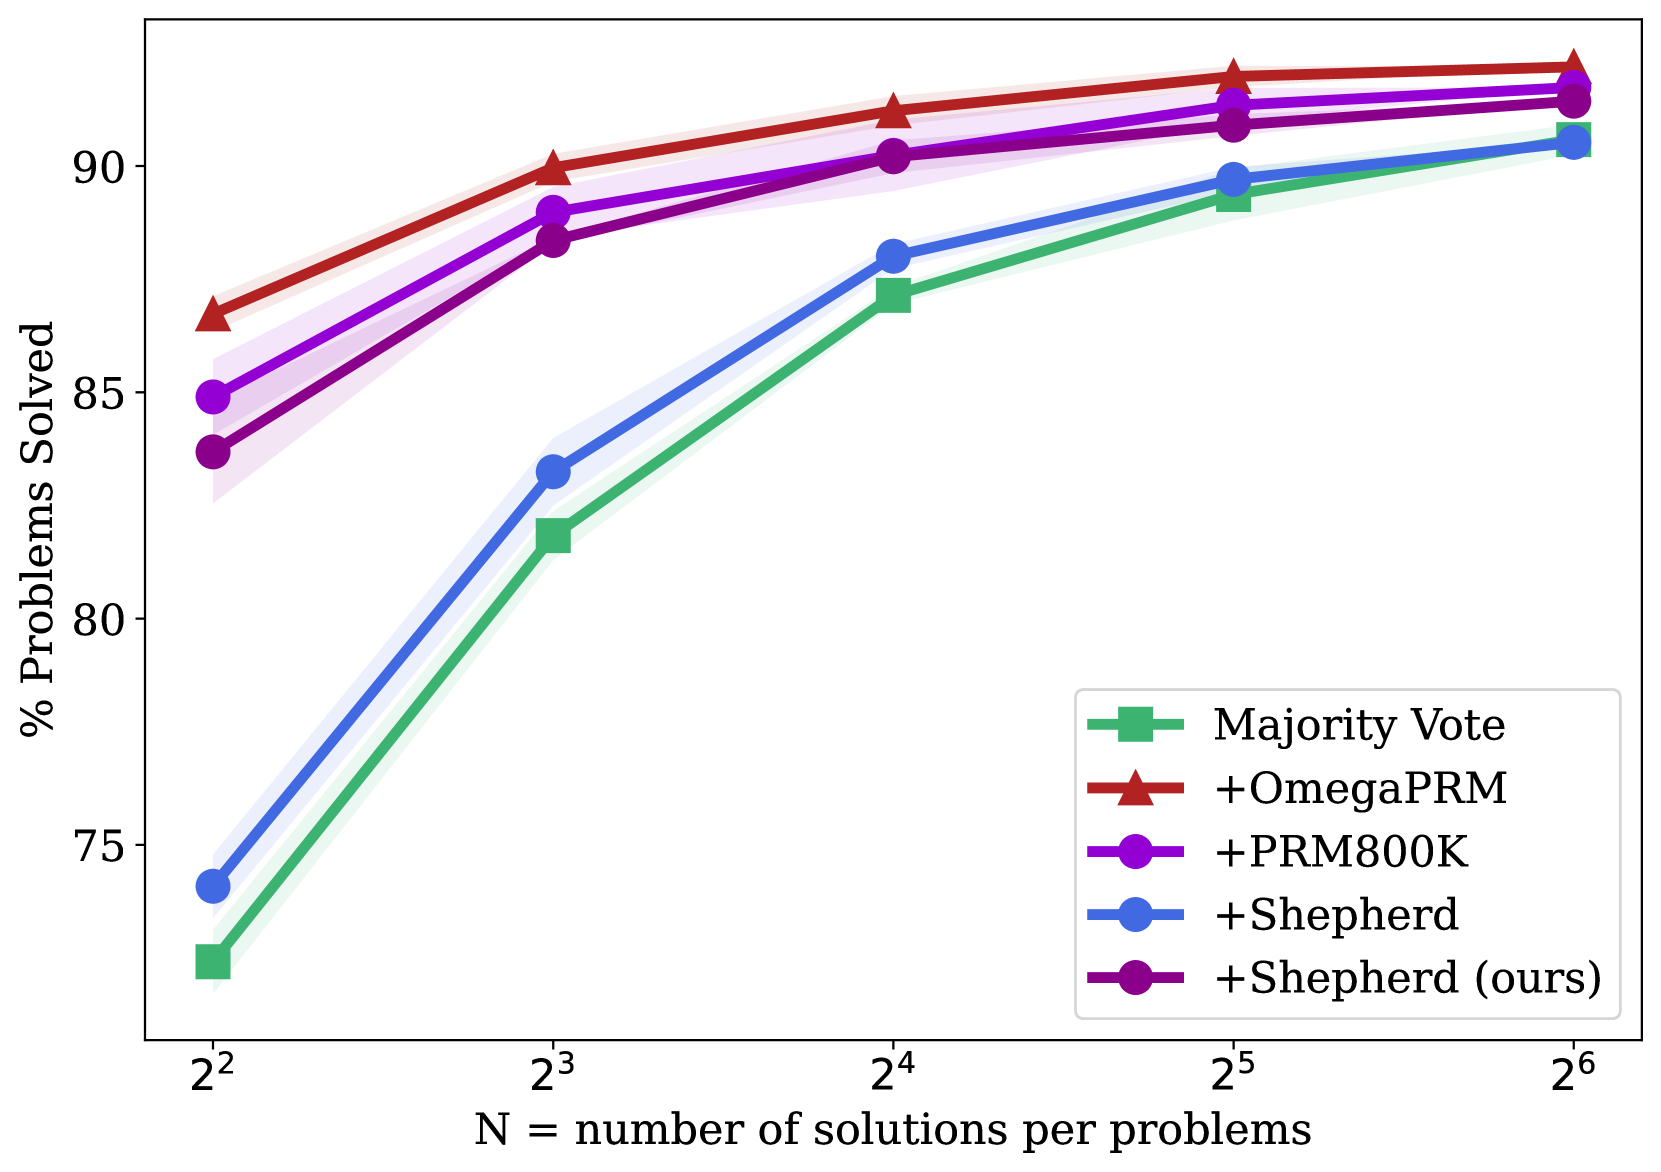
This line chart compares the performance of several problem-solving methods as a function of the number of solutions generated per problem. The performance metric is the percentage of problems solved. The chart displays five different methods: Majority Vote, +OmegaPRM, +PRM800K, +Shepherd, and +Shepherd (ours).
### Components/Axes
* **X-axis:** "N = number of solutions per problems". The scale is logarithmic, with markers at 2<sup>2</sup> (4), 2<sup>3</sup> (8), 2<sup>4</sup> (16), 2<sup>5</sup> (32), and 2<sup>6</sup> (64).
* **Y-axis:** "% Problems Solved". The scale ranges from approximately 74% to 93%.
* **Legend:** Located in the top-right corner. It maps colors to the following methods:
* Green: Majority Vote
* Red: +OmegaPRM
* Magenta: +PRM800K
* Blue: +Shepherd
* Purple: +Shepherd (ours)
### Detailed Analysis
Here's a breakdown of each line's trend and approximate data points, verified against the legend colors:
* **Majority Vote (Green):** This line starts at approximately 74% at N=4 and increases steadily, reaching around 88% at N=64. The slope is relatively consistent.
* N=4: ~74%
* N=8: ~81%
* N=16: ~87%
* N=32: ~90%
* N=64: ~88%
* **+OmegaPRM (Red):** This line begins at approximately 86% at N=4 and shows a slight increase, plateauing around 92-93% for N > 16.
* N=4: ~86%
* N=8: ~89%
* N=16: ~92%
* N=32: ~93%
* N=64: ~93%
* **+PRM800K (Magenta):** This line starts at approximately 84% at N=4 and increases to around 92% at N=64. It exhibits a similar trend to +OmegaPRM, but starts slightly lower.
* N=4: ~84%
* N=8: ~88%
* N=16: ~91%
* N=32: ~92%
* N=64: ~92%
* **+Shepherd (Blue):** This line begins at approximately 76% at N=4 and increases more rapidly than Majority Vote, reaching around 90% at N=64.
* N=4: ~76%
* N=8: ~84%
* N=16: ~89%
* N=32: ~90%
* N=64: ~90%
* **+Shepherd (ours) (Purple):** This line starts at approximately 86% at N=4 and shows a slight increase, plateauing around 92-93% for N > 16. It is very similar to +OmegaPRM.
* N=4: ~86%
* N=8: ~89%
* N=16: ~92%
* N=32: ~93%
* N=64: ~93%
### Key Observations
* The "+OmegaPRM" and "+Shepherd (ours)" methods achieve the highest performance, consistently above 92% for N >= 16.
* Majority Vote has the lowest performance, but still shows improvement with increasing N.
* "+Shepherd" performs better than "+PRM800K" across all values of N.
* The performance gains diminish as N increases beyond 16 for most methods.
### Interpretation
The data suggests that increasing the number of solutions generated per problem generally improves the percentage of problems solved. However, there's a diminishing return to scale. The "+OmegaPRM" and "+Shepherd (ours)" methods are the most effective, indicating that the techniques used in these methods are particularly well-suited for this type of problem-solving task. The fact that "+Shepherd (ours)" performs similarly to "+OmegaPRM" suggests that the modifications made in "+Shepherd (ours)" have not significantly altered its performance relative to "+OmegaPRM". The lower performance of Majority Vote suggests that simply aggregating solutions without more sophisticated techniques is less effective. The logarithmic scale on the x-axis highlights the increasing computational cost of generating more solutions, and the plateauing performance suggests that the benefits of generating more solutions eventually outweigh the costs.