## Line Chart: Percentage of Problems Solved vs. Number of Solutions per Problem
### Overview
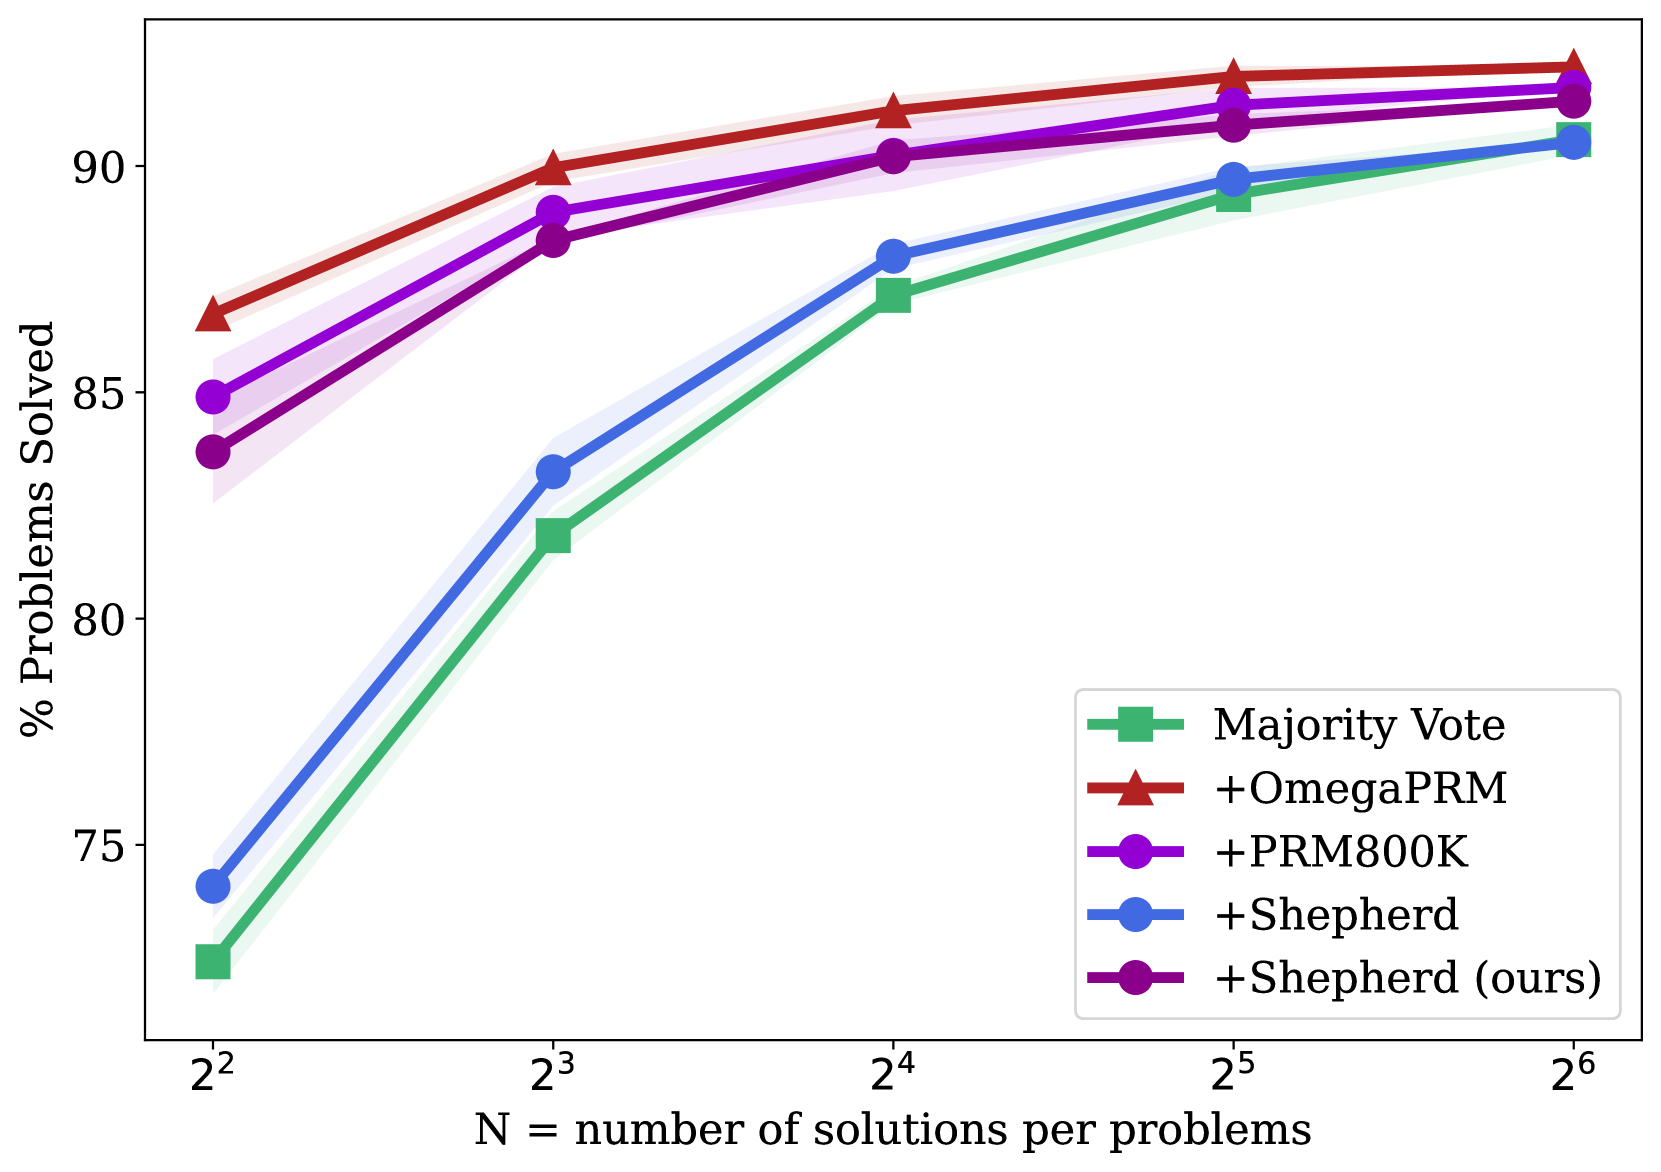
The chart illustrates the performance of five algorithms in solving problems as the number of solutions per problem (N) increases. The y-axis represents the percentage of problems solved, while the x-axis shows N on a logarithmic scale (2² to 2⁶). Each algorithm is represented by a distinct line with markers, and shaded regions indicate confidence intervals.
### Components/Axes
- **X-axis**: "N = number of solutions per problems" (logarithmic scale: 2², 2³, 2⁴, 2⁵, 2⁶).
- **Y-axis**: "% Problems Solved" (70% to 95%).
- **Legend**: Located on the right, with five algorithms:
- **Majority Vote** (green squares).
- **+OmegaPRM** (red triangles).
- **+PRM800K** (purple circles).
- **+Shepherd** (blue circles).
- **+Shepherd (ours)** (dark purple circles).
- **Title**: "Percentage of Problems Solved vs. Number of Solutions per Problem" (centered at the top).
### Detailed Analysis
1. **Majority Vote** (green squares):
- Starts at ~72% at N=2², rising to ~90% at N=2⁶.
- Shows a steady upward trend but lags behind other algorithms.
- Confidence interval widens slightly at lower N values.
2. **+OmegaPRM** (red triangles):
- Consistently the highest-performing algorithm.
- Starts at ~86% at N=2², reaching ~92% at N=2⁶.
- Maintains a narrow confidence interval, indicating stable performance.
3. **+PRM800K** (purple circles):
- Second-highest performance, starting at ~85% at N=2² and reaching ~91% at N=2⁶.
- Slightly outperforms +Shepherd (ours) at higher N values.
4. **+Shepherd** (blue circles):
- Starts at ~74% at N=2², rising to ~90% at N=2⁶.
- Confidence interval widens more than +OmegaPRM but less than Majority Vote.
5. **+Shepherd (ours)** (dark purple circles):
- Similar to +Shepherd but slightly higher performance.
- Starts at ~84% at N=2², reaching ~91% at N=2⁶.
- Confidence interval is narrower than +Shepherd but wider than +OmegaPRM.
### Key Observations
- **+OmegaPRM** dominates across all N values, suggesting superior optimization or problem-solving efficiency.
- **Majority Vote** improves significantly with more solutions but remains the least effective.
- **+Shepherd (ours)** and **+Shepherd** show comparable performance, with the "ours" variant slightly better.
- All algorithms exhibit upward trends, indicating that increasing N improves problem-solving capacity.
- Confidence intervals are tightest for +OmegaPRM, reflecting higher reliability in its results.
### Interpretation
The data demonstrates that **adding more solutions per problem (N)** enhances the performance of all algorithms, with **+OmegaPRM** achieving the highest efficiency. The logarithmic scale on the x-axis highlights exponential growth in N, emphasizing that performance gains are more pronounced at higher N values.
- **Why +OmegaPRM excels**: Its consistent top performance suggests it may leverage solutions more effectively, possibly through advanced optimization techniques or better handling of problem constraints.
- **Majority Vote's limitations**: Despite improvement, its lower performance indicates it may lack the sophistication to utilize additional solutions as effectively as other algorithms.
- **Shepherd variants**: The close performance between +Shepherd and +Shepherd (ours) implies that the "ours" version introduces minor but meaningful enhancements, such as improved initialization or solution selection strategies.
This chart underscores the importance of algorithm design in leveraging computational resources (e.g., more solutions) to solve problems. The results could guide future research into optimizing solution generation or selection strategies for complex tasks.