## Bar Chart: Decode Throughput vs. Batch Size
### Overview
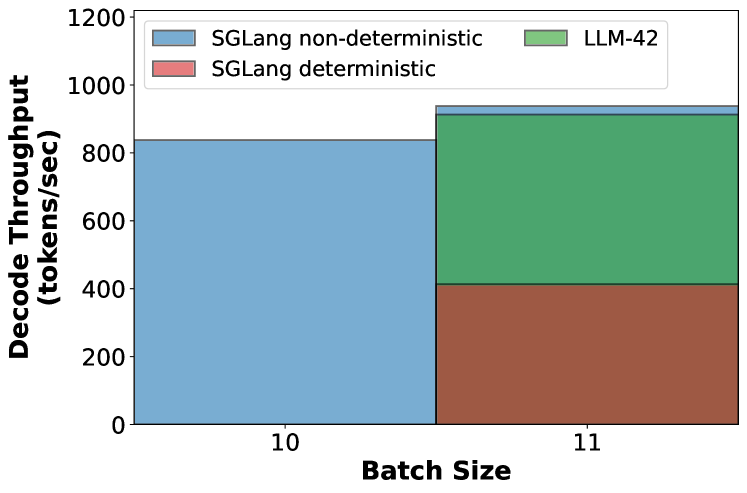
The image is a bar chart comparing the decode throughput (tokens/sec) for different configurations across two batch sizes (10 and 11). The chart compares "SGLang non-deterministic", "SGLang deterministic", and "LLM-42".
### Components/Axes
* **X-axis:** Batch Size, with values 10 and 11.
* **Y-axis:** Decode Throughput (tokens/sec), ranging from 0 to 1200.
* **Legend (top-left):**
* SGLang non-deterministic (light blue)
* SGLang deterministic (light red/brown)
* LLM-42 (light green)
### Detailed Analysis
* **Batch Size 10:**
* SGLang non-deterministic: Approximately 840 tokens/sec.
* SGLang deterministic: Not present for batch size 10.
* LLM-42: Not present for batch size 10.
* **Batch Size 11:**
* SGLang non-deterministic: Approximately 940 tokens/sec.
* SGLang deterministic: Approximately 420 tokens/sec.
* LLM-42: Approximately 520 tokens/sec.
### Key Observations
* For batch size 10, only SGLang non-deterministic data is available.
* For batch size 11, all three configurations (SGLang non-deterministic, SGLang deterministic, and LLM-42) are present.
* SGLang non-deterministic throughput increases from batch size 10 to 11.
### Interpretation
The chart compares the decode throughput of different language model configurations at batch sizes 10 and 11. The data suggests that increasing the batch size from 10 to 11 improves the throughput of SGLang non-deterministic. The introduction of SGLang deterministic and LLM-42 at batch size 11 allows for a direct comparison of their performance. LLM-42 has a slightly higher throughput than SGLang deterministic at batch size 11.