## Line Chart: Model Accuracy Across Various Tasks
### Overview
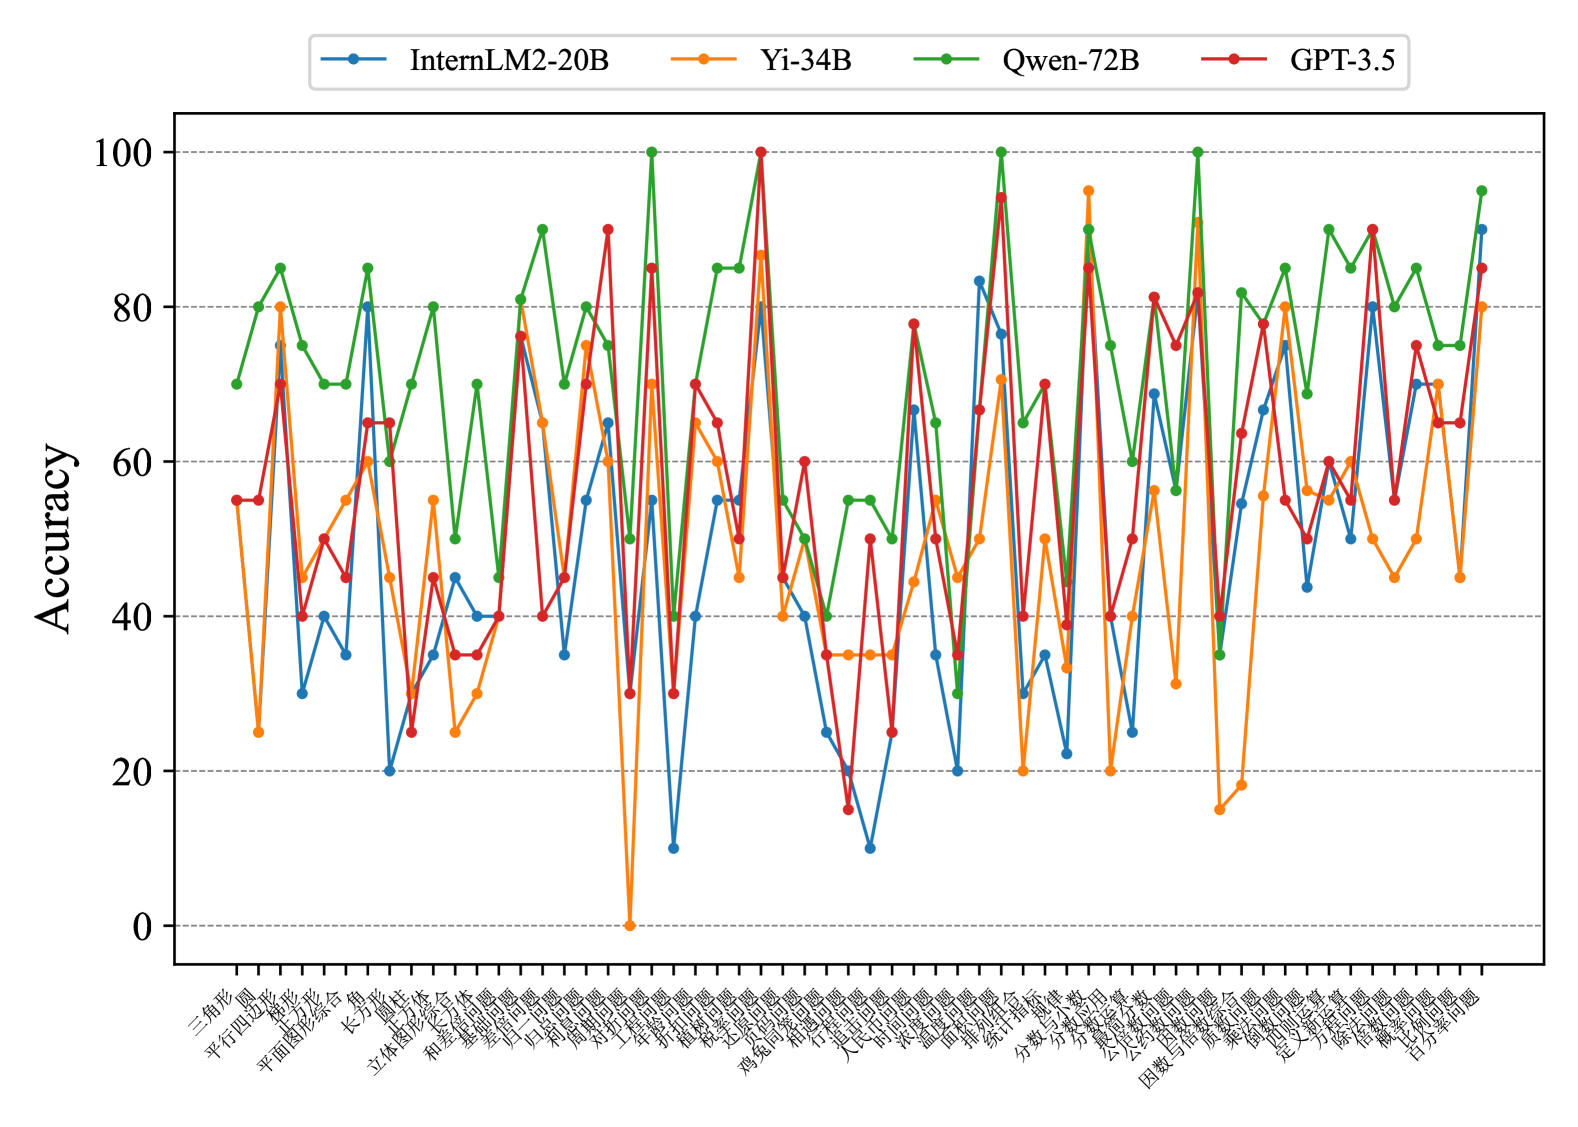
This image presents a line chart comparing the accuracy of four different language models – InternLM2-20B, Yi-34B, Qwen-72B, and GPT-3.5 – across a series of tasks. The x-axis represents the tasks, labeled in Chinese characters, and the y-axis represents the accuracy, ranging from 0 to 100.
### Components/Axes
* **X-axis:** Task names, labeled in Chinese. The labels are densely packed and appear to represent different evaluation tasks.
* **Y-axis:** Accuracy, ranging from 0 to 100, with increments of 10. The axis is labeled "Accuracy".
* **Legend:** Located at the top of the chart, identifying each line with a color and model name:
* Blue: InternLM2-20B
* Green: Yi-34B
* Black: Qwen-72B
* Orange: GPT-3.5
### Detailed Analysis
The chart displays accuracy scores for each model across approximately 30 tasks. The task names are in Chinese, making precise identification difficult without translation. Here's a breakdown of the trends and approximate data points, noting the uncertainty due to the density of the chart and the difficulty in reading the x-axis labels:
* **InternLM2-20B (Blue Line):** This line exhibits significant fluctuations, ranging from approximately 15 to 85. It generally starts around 60, dips to around 20, then rises to a peak of approximately 85 before fluctuating again.
* **Yi-34B (Green Line):** This line consistently shows the highest accuracy scores, generally staying above 70 and peaking around 95. It has fewer dips than the other models.
* **Qwen-72B (Black Line):** This line fluctuates between approximately 40 and 80. It starts around 70, dips to around 40, and then rises and falls several times.
* **GPT-3.5 (Orange Line):** This line shows the most variability, with accuracy scores ranging from approximately 10 to 90. It starts around 50, drops to a low of around 10, and then experiences several peaks and valleys.
Here's a more detailed, though approximate, extraction of data points for a few selected tasks (assuming the tasks are numbered 1-30 from left to right):
| Task | InternLM2-20B | Yi-34B | Qwen-72B | GPT-3.5 |
|---|---|---|---|---|
| 1 | ~60 | ~80 | ~70 | ~50 |
| 5 | ~20 | ~90 | ~40 | ~10 |
| 10 | ~85 | ~95 | ~80 | ~60 |
| 15 | ~50 | ~75 | ~60 | ~40 |
| 20 | ~70 | ~85 | ~75 | ~70 |
| 25 | ~30 | ~90 | ~50 | ~20 |
| 30 | ~65 | ~80 | ~65 | ~55 |
**Note:** These values are approximate due to the chart's resolution and the difficulty in reading the x-axis labels.
### Key Observations
* Yi-34B consistently outperforms the other models across all tasks.
* GPT-3.5 exhibits the highest degree of variability in accuracy.
* InternLM2-20B and Qwen-72B show similar levels of performance, with moderate fluctuations.
* There are several tasks where GPT-3.5's accuracy drops significantly, indicating potential weaknesses in specific areas.
### Interpretation
The chart demonstrates a clear hierarchy in model performance, with Yi-34B being the most robust and consistent performer. The significant fluctuations in GPT-3.5's accuracy suggest that its performance is highly task-dependent. The Chinese task labels indicate that the evaluation was conducted on a dataset tailored to the Chinese language or specific Chinese cultural contexts. The wide range of accuracy scores across different tasks highlights the challenges in building general-purpose language models that perform well on all types of tasks. The data suggests that Yi-34B is a strong contender for applications requiring high accuracy and consistency, while GPT-3.5 may be more suitable for tasks where some variability is acceptable. Further investigation into the specific tasks represented on the x-axis would be necessary to understand the strengths and weaknesses of each model in more detail. The consistent high performance of Yi-34B could be attributed to its architecture, training data, or optimization techniques.