## Diagram: Agent Workflow
### Overview
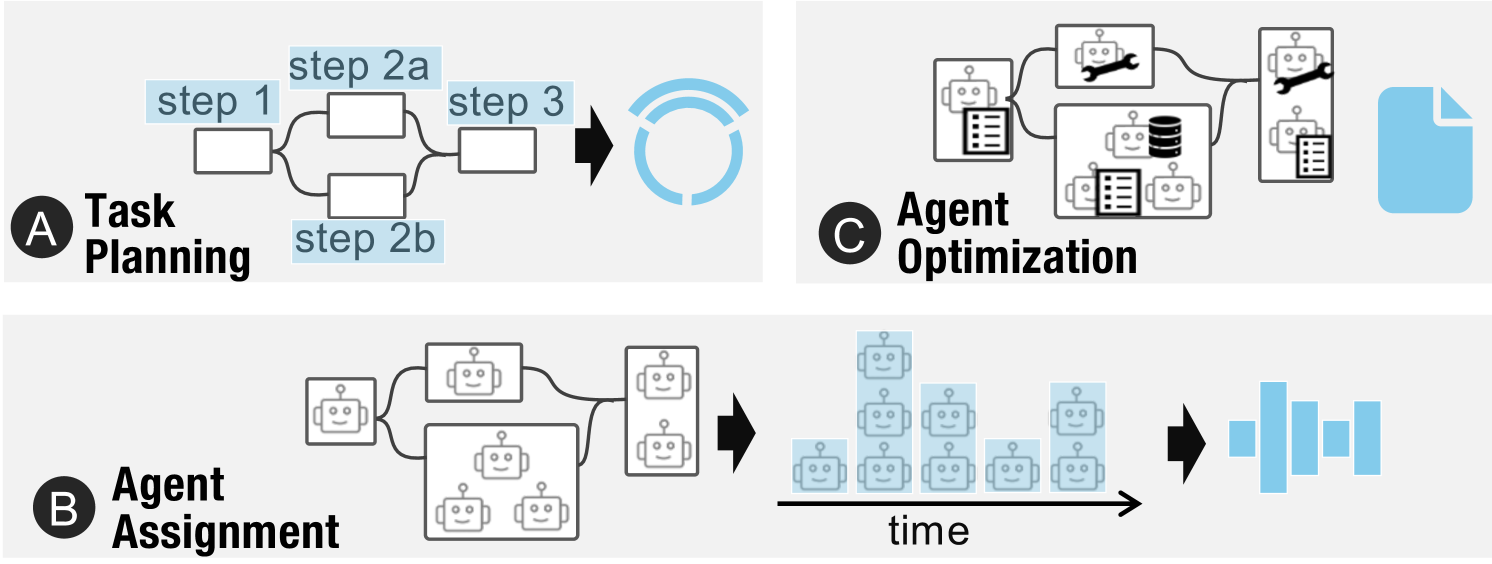
The image illustrates a workflow involving agents, broken down into three main stages: Task Planning, Agent Assignment, and Agent Optimization. Each stage is represented by a diagram showing the flow of information or resources.
### Components/Axes
* **Section A: Task Planning**
* Labels: "A Task Planning"
* Steps: "step 1", "step 2a", "step 2b", "step 3"
* Flow: A process starts with "step 1", splits into "step 2a" and "step 2b", then merges into "step 3", leading to a circular process represented by a broken circle.
* **Section B: Agent Assignment**
* Labels: "B Agent Assignment"
* Components: Boxes containing robot icons, representing agents.
* Flow: Agents are grouped and then reassigned, indicated by arrows.
* **Section C: Agent Optimization**
* Labels: "C Agent Optimization"
* Components: Boxes containing robot icons with tools (wrench) or lists, representing agent capabilities. A database icon is also present.
* Output: A document icon.
* **Time Axis**: In the middle of the bottom row, a horizontal arrow labeled "time" indicates the progression of agent activity.
* **Agent Count**: The number of robot icons stacked vertically represents the number of agents at a given time.
### Detailed Analysis
* **Task Planning:**
* The process begins with a single task ("step 1").
* The task splits into two parallel sub-tasks ("step 2a" and "step 2b").
* These sub-tasks converge into a single task ("step 3").
* The process then enters a cyclical phase, indicated by the broken circle.
* **Agent Assignment:**
* Agents are initially grouped into two clusters: one with a single agent and another with three agents.
* These agents are then reassigned into two groups of two agents each.
* The flow suggests a redistribution or balancing of agents.
* **Agent Optimization:**
* Agents are depicted with different capabilities: some with tools (wrench), some with lists, and some connected to a database.
* The process involves optimizing these agents, leading to a final output represented by a document.
* **Time-Based Agent Activity:**
* The number of agents varies over time, as shown by the stacked robot icons.
* The agent count starts low, peaks in the middle, and then decreases.
* The final output is represented by a series of vertical bars, suggesting a processed or summarized result.
### Key Observations
* The workflow progresses from planning to assignment and then to optimization.
* Agent capabilities and assignments are dynamically adjusted throughout the process.
* The time-based agent activity shows a fluctuating demand for agents.
### Interpretation
The diagram illustrates a dynamic workflow where tasks are planned, agents are assigned and reassigned, and their capabilities are optimized. The cyclical nature of the task planning stage suggests continuous refinement or iteration. The agent assignment stage indicates a need for flexible resource allocation. The agent optimization stage highlights the importance of equipping agents with the right tools and data. The time-based agent activity suggests that the demand for agents varies depending on the stage of the workflow. Overall, the diagram depicts a sophisticated system that adapts to changing needs and optimizes agent performance.