\n
## Line Chart: Surprisal vs. Training Steps
### Overview
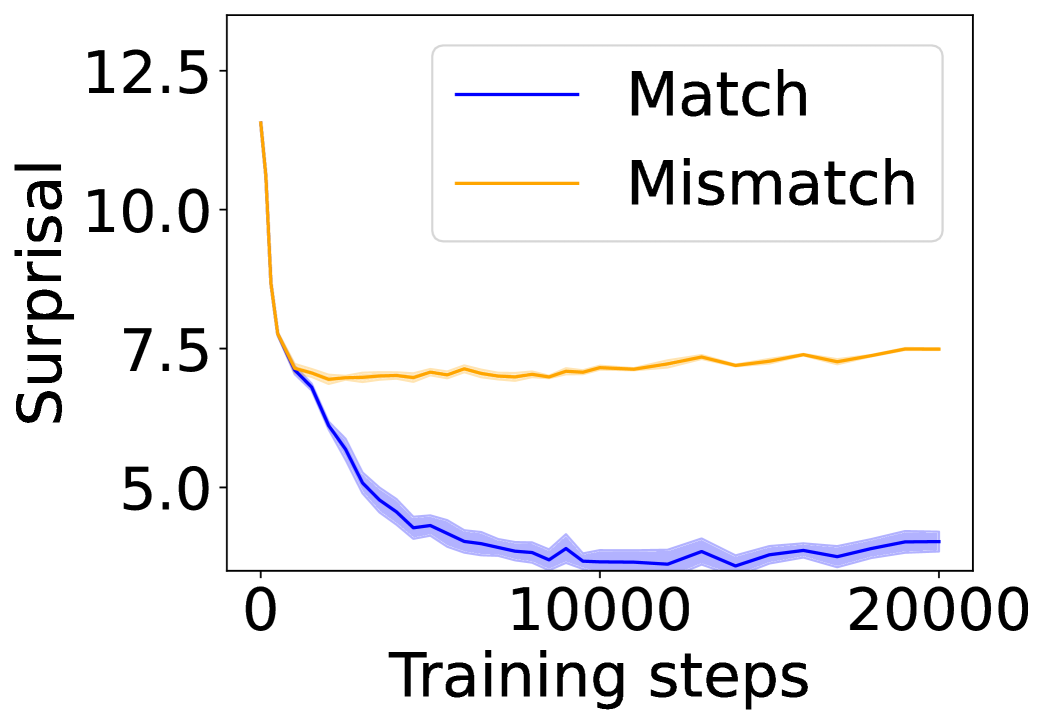
The image presents a line chart illustrating the relationship between "Surprisal" (y-axis) and "Training steps" (x-axis). Two data series are plotted: one representing "Match" and the other "Mismatch". The chart appears to track the surprisal of a model during training, potentially indicating how well the model is learning to predict or represent the data.
### Components/Axes
* **X-axis:** "Training steps", ranging from approximately 0 to 20000. The axis is linearly scaled.
* **Y-axis:** "Surprisal", ranging from approximately 4.5 to 12.5. The axis is linearly scaled.
* **Legend:** Located in the top-right corner.
* "Match" - represented by a dark blue line.
* "Mismatch" - represented by an orange line.
### Detailed Analysis
**Match (Dark Blue Line):**
The "Match" line begins at approximately 6.0 at 0 training steps. It exhibits a steep downward trend initially, decreasing to a minimum of approximately 4.2 at around 2000 training steps. After this point, the line plateaus and fluctuates between approximately 4.2 and 5.0 until 20000 training steps, ending at approximately 4.6.
**Mismatch (Orange Line):**
The "Mismatch" line starts at approximately 7.5 at 0 training steps. It shows a slight initial decrease to around 7.2 at 2000 training steps. From 2000 to 20000 training steps, the line remains relatively stable, fluctuating between approximately 7.2 and 7.8, ending at approximately 7.6.
### Key Observations
* The "Match" line consistently exhibits lower surprisal values than the "Mismatch" line throughout the entire training process.
* The "Match" line demonstrates a significant decrease in surprisal during the initial 2000 training steps, suggesting rapid learning or adaptation.
* Both lines appear to converge towards a stable state after approximately 2000 training steps, indicating that the rate of change in surprisal diminishes over time.
* The "Mismatch" line shows minimal change in surprisal, suggesting that the model struggles to learn or represent the mismatched data.
### Interpretation
The chart suggests that the model is learning to better represent or predict the "Match" data as training progresses, as evidenced by the decreasing surprisal. The relatively constant surprisal for the "Mismatch" data indicates that the model is not effectively learning from this data, potentially due to inherent differences or complexities in the mismatched examples. The convergence of both lines towards stable values after 2000 training steps suggests that the model's learning capacity or the effectiveness of the training process may be reaching a limit. The difference in surprisal between the two conditions could be used as a metric to evaluate the model's ability to distinguish between matched and mismatched data. The data suggests that the model is more successful at learning the "Match" data than the "Mismatch" data.