\n
## Charts: Dropout Performance Analysis
### Overview
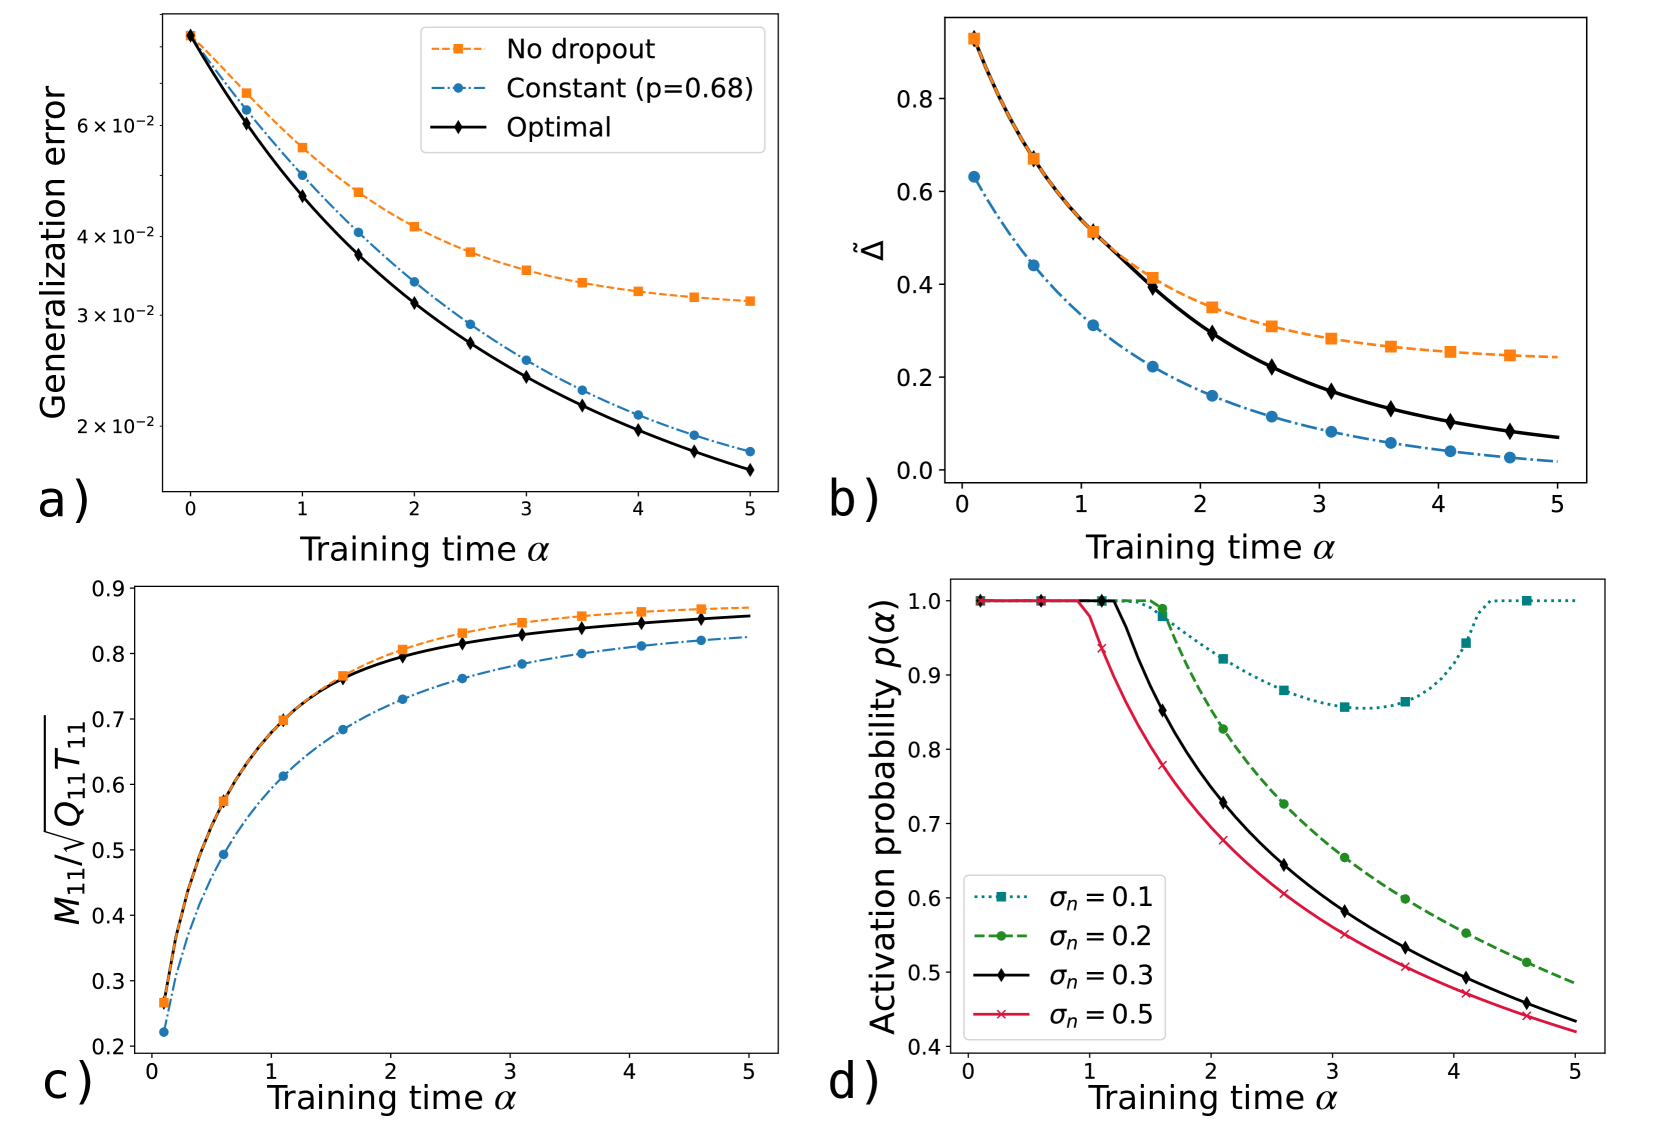
The image presents four separate charts (a, b, c, and d) illustrating the performance of neural networks with different dropout strategies during training. The charts explore the relationship between training time (α) and various metrics related to generalization error, parameter change, and activation probability.
### Components/Axes
Each chart shares a common x-axis: "Training time α", ranging from 0 to 5.
* **Chart a:** Y-axis: "Generalization error" (scale: 0 to 6.5 x 10^-2).
* **Chart b:** Y-axis: "Δ" (scale: 0 to 0.8).
* **Chart c:** Y-axis: "M₁/Q₁T₁₁" (scale: 0.2 to 0.9).
* **Chart d:** Y-axis: "Activation probability p(α)" (scale: 0.3 to 1.0).
**Legend (Top-Right, applies to all charts):**
* "No dropout" (dashed orange line)
* "Constant (p=0.68)" (dashed blue line)
* "Optimal" (solid black line)
* **Chart d specific:**
* "σn = 0.1" (dashed red line)
* "σn = 0.2" (dashed green line)
* "σn = 0.3" (solid black line)
* "σn = 0.5" (solid purple line)
### Detailed Analysis or Content Details
**Chart a: Generalization Error vs. Training Time**
The "Optimal" line (black) shows a steep initial decrease in generalization error, leveling off around α = 3, reaching approximately 1.8 x 10^-2. The "Constant (p=0.68)" line (blue) also decreases, but at a slower rate, ending around 3.5 x 10^-2. The "No dropout" line (orange) exhibits the slowest decrease, remaining around 5.5 x 10^-2 at α = 5.
**Chart b: Δ vs. Training Time**
The "Optimal" line (black) shows a rapid decrease in Δ, approaching 0 around α = 4. The "Constant (p=0.68)" line (blue) decreases more gradually, ending around 0.2. The "No dropout" line (orange) decreases slowly, remaining around 0.6 at α = 5.
**Chart c: M₁/Q₁T₁₁ vs. Training Time**
The "Optimal" line (black) increases rapidly initially, reaching approximately 0.85 around α = 2 and leveling off. The "Constant (p=0.68)" line (blue) shows a slower increase, reaching approximately 0.7 at α = 5. The "No dropout" line (orange) increases at a moderate rate, reaching approximately 0.65 at α = 5.
**Chart d: Activation Probability p(α) vs. Training Time**
The "σn = 0.5" line (purple) starts at approximately 0.4 and increases rapidly to around 0.9 at α = 5. The "σn = 0.3" line (black) starts at approximately 0.7 and increases to around 0.95 at α = 5. The "σn = 0.2" line (green) starts at approximately 0.8 and increases to around 0.98 at α = 5. The "σn = 0.1" line (red) starts at approximately 0.9 and increases to around 1.0 at α = 5.
### Key Observations
* The "Optimal" dropout strategy consistently outperforms both "Constant" and "No dropout" in terms of generalization error (Chart a) and parameter change (Chart b).
* The activation probability (Chart d) increases with training time (α) for all noise levels (σn). Higher noise levels (lower σn) result in lower initial activation probabilities.
* Chart c shows that the ratio M₁/Q₁T₁₁ increases with training time for all dropout strategies.
### Interpretation
These charts demonstrate the effectiveness of an "Optimal" dropout strategy in improving the generalization performance of neural networks. Dropout, by randomly disabling neurons during training, prevents overfitting and leads to a lower generalization error (Chart a). The parameter change metric (Chart b) suggests that the "Optimal" strategy allows for more efficient parameter updates during training. The activation probability (Chart d) indicates that dropout introduces stochasticity into the network, influencing the activation patterns of neurons. The relationship between M₁/Q₁T₁₁ and training time (Chart c) suggests a dynamic adjustment of network parameters during the learning process. The consistent outperformance of the "Optimal" strategy suggests that it effectively balances the trade-off between exploration and exploitation during training, leading to a more robust and generalizable model. The different noise levels in Chart d show how the initial activation probability is affected by the dropout rate.