# Technical Data Extraction: Honesty Accuracy vs. Honesty Control Coefficient
## 1. Image Overview
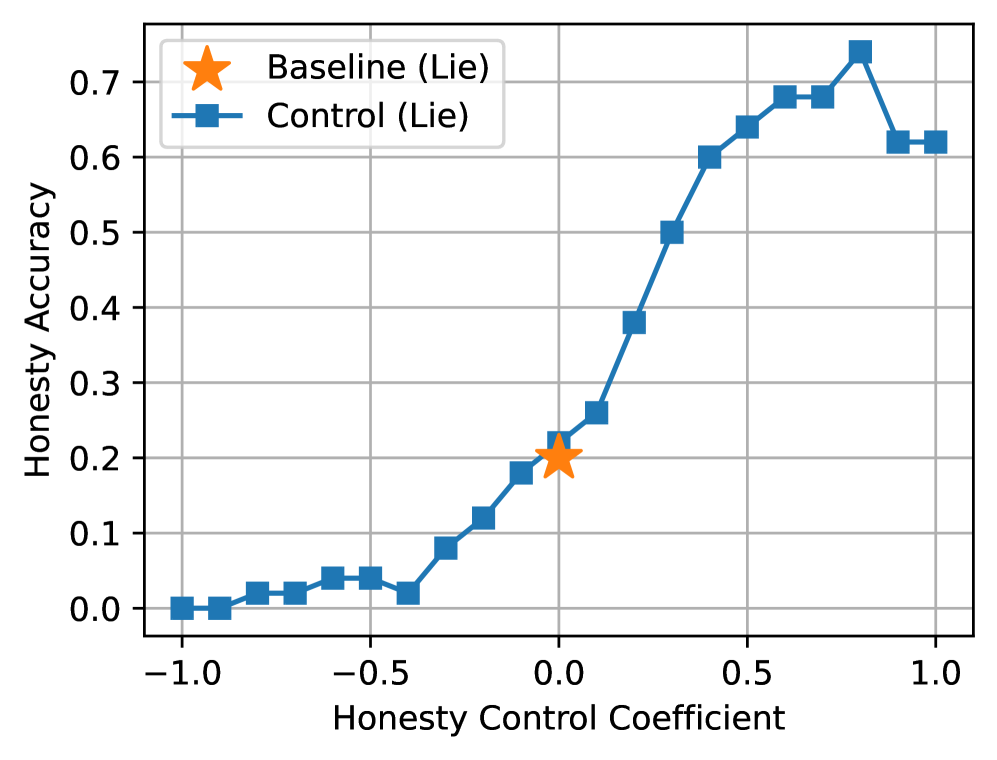
This image is a line graph with a single data series and a baseline reference point. It measures the relationship between a control parameter and the resulting accuracy of a model or system in a "Lie" condition.
## 2. Component Isolation
### Header / Metadata
* **Language:** English
* **Legend Location:** Top-left corner [approx. x=0.1, y=0.85 relative to plot area].
* **Legend Items:**
* **Baseline (Lie):** Represented by a large orange star symbol.
* **Control (Lie):** Represented by a blue line with square markers.
### Axis Configuration
* **Y-Axis (Vertical):**
* **Label:** Honesty Accuracy
* **Range:** 0.0 to 0.7 (with markers extending to ~0.75)
* **Major Tick Intervals:** 0.1 (0.0, 0.1, 0.2, 0.3, 0.4, 0.5, 0.6, 0.7)
* **X-Axis (Horizontal):**
* **Label:** Honesty Control Coefficient
* **Range:** -1.0 to 1.0
* **Major Tick Intervals:** 0.5 (-1.0, -0.5, 0.0, 0.5, 1.0)
* **Minor Grid Intervals:** 0.1
## 3. Data Series Analysis
### Baseline (Lie) - Orange Star
* **Trend:** A single static reference point.
* **Coordinates:** Located at [0.0, 0.2].
* **Interpretation:** At a neutral coefficient (0.0), the baseline honesty accuracy is 20%.
### Control (Lie) - Blue Line with Squares
* **Trend Verification:**
* From $x = -1.0$ to $-0.4$, the line is relatively flat, hovering near $y = 0.0$.
* From $x = -0.4$ to $0.8$, the line shows a strong, positive monotonic slope (upward trend).
* From $x = 0.8$ to $1.0$, the line experiences a sharp decline followed by a plateau.
**Data Point Extraction (Approximate based on grid):**
| Honesty Control Coefficient (x) | Honesty Accuracy (y) | Notes |
| :--- | :--- | :--- |
| -1.0 | 0.00 | Start of series |
| -0.9 | 0.00 | |
| -0.8 | 0.02 | Slight increase |
| -0.7 | 0.02 | |
| -0.6 | 0.04 | |
| -0.5 | 0.04 | |
| -0.4 | 0.02 | Local dip |
| -0.3 | 0.08 | Upward trend begins |
| -0.2 | 0.12 | |
| -0.1 | 0.18 | |
| **0.0** | **0.22** | **Slightly outperforms Baseline (0.2)** |
| 0.1 | 0.26 | |
| 0.2 | 0.38 | Steepening slope |
| 0.3 | 0.50 | |
| 0.4 | 0.60 | |
| 0.5 | 0.64 | |
| 0.6 | 0.68 | |
| 0.7 | 0.68 | Plateau |
| 0.8 | 0.74 | Peak Accuracy |
| 0.9 | 0.62 | Sharp drop |
| 1.0 | 0.62 | Final plateau |
## 4. Key Findings and Observations
1. **Correlation:** There is a strong positive correlation between the "Honesty Control Coefficient" and "Honesty Accuracy" between the values of -0.4 and 0.8.
2. **Baseline Comparison:** The "Control (Lie)" method tracks very closely to the "Baseline (Lie)" at the 0.0 coefficient mark, though it appears marginally higher (approx 0.22 vs 0.20).
3. **Optimal Range:** The system reaches peak accuracy (approx 74%) when the Honesty Control Coefficient is set to 0.8.
4. **Negative Coefficients:** Setting the coefficient below -0.4 results in near-zero honesty accuracy, suggesting the control effectively suppresses the target behavior in this range.
5. **Saturation/Degradation:** Beyond a coefficient of 0.8, the accuracy drops significantly, suggesting an "over-correction" or instability in the control mechanism at maximum values.