\n
## Line Chart: Honesty Accuracy vs. Honesty Control Coefficient
### Overview
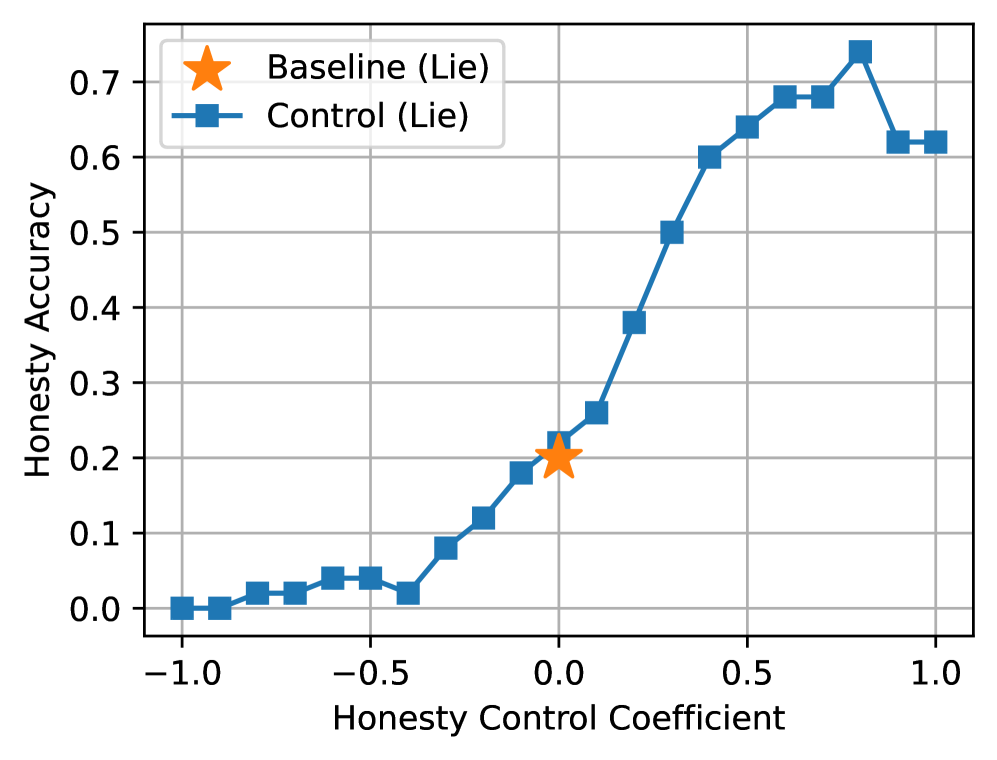
This image presents a line chart illustrating the relationship between "Honesty Control Coefficient" and "Honesty Accuracy". Two data series are plotted: a "Baseline (Lie)" represented by orange star markers, and a "Control (Lie)" represented by blue square markers connected by a line. The chart appears to evaluate the accuracy of detecting dishonesty as the level of honesty control is adjusted.
### Components/Axes
* **X-axis:** "Honesty Control Coefficient" ranging from approximately -1.0 to 1.0, with tick marks at -1.0, -0.5, 0.0, 0.5, and 1.0.
* **Y-axis:** "Honesty Accuracy" ranging from 0.0 to 0.75, with tick marks at 0.0, 0.1, 0.2, 0.3, 0.4, 0.5, 0.6, 0.7.
* **Legend:** Located in the top-left corner.
* "Baseline (Lie)" - Orange star marker.
* "Control (Lie)" - Blue square marker.
* **Gridlines:** Horizontal and vertical gridlines are present to aid in reading values.
### Detailed Analysis
**Baseline (Lie) Data Series:**
The Baseline data series consists of a single data point.
* Honesty Control Coefficient: Approximately 0.0
* Honesty Accuracy: Approximately 0.2
**Control (Lie) Data Series:**
The Control data series shows a generally upward trend as the Honesty Control Coefficient increases.
* Honesty Control Coefficient: -1.0, Honesty Accuracy: Approximately 0.02
* Honesty Control Coefficient: -0.5, Honesty Accuracy: Approximately 0.05
* Honesty Control Coefficient: 0.0, Honesty Accuracy: Approximately 0.25
* Honesty Control Coefficient: 0.5, Honesty Accuracy: Approximately 0.62
* Honesty Control Coefficient: 0.75, Honesty Accuracy: Approximately 0.72
* Honesty Control Coefficient: 1.0, Honesty Accuracy: Approximately 0.63
### Key Observations
* The "Control (Lie)" line demonstrates a significant increase in Honesty Accuracy as the Honesty Control Coefficient moves from -1.0 to approximately 0.75.
* The accuracy plateaus and slightly decreases at a Honesty Control Coefficient of 1.0.
* The "Baseline (Lie)" accuracy is significantly lower than the "Control (Lie)" accuracy across the range of Honesty Control Coefficients.
* The "Control (Lie)" data series shows a steep increase in accuracy between Honesty Control Coefficients of 0.0 and 0.5.
### Interpretation
The data suggests that implementing an "Honesty Control Coefficient" can significantly improve the accuracy of detecting lies. The accuracy increases as the coefficient becomes more positive, indicating that a higher level of honesty control leads to better lie detection. However, there appears to be a point of diminishing returns, as accuracy plateaus and slightly decreases at a coefficient of 1.0. This could indicate that excessive honesty control may introduce other factors that hinder accurate lie detection.
The "Baseline (Lie)" data point serves as a reference point, showing the accuracy of lie detection without any honesty control. The substantial difference between the "Baseline" and "Control" data series highlights the effectiveness of the implemented honesty control mechanism.
The steep increase in accuracy between 0.0 and 0.5 suggests that the initial stages of honesty control have the most significant impact on lie detection. The plateauing at higher coefficients suggests that further increases in control yield smaller improvements. This could be due to the inherent limitations of lie detection methods or the introduction of unintended consequences from excessive control.