## Line Graph: Honesty Accuracy vs. Honesty Control Coefficient
### Overview
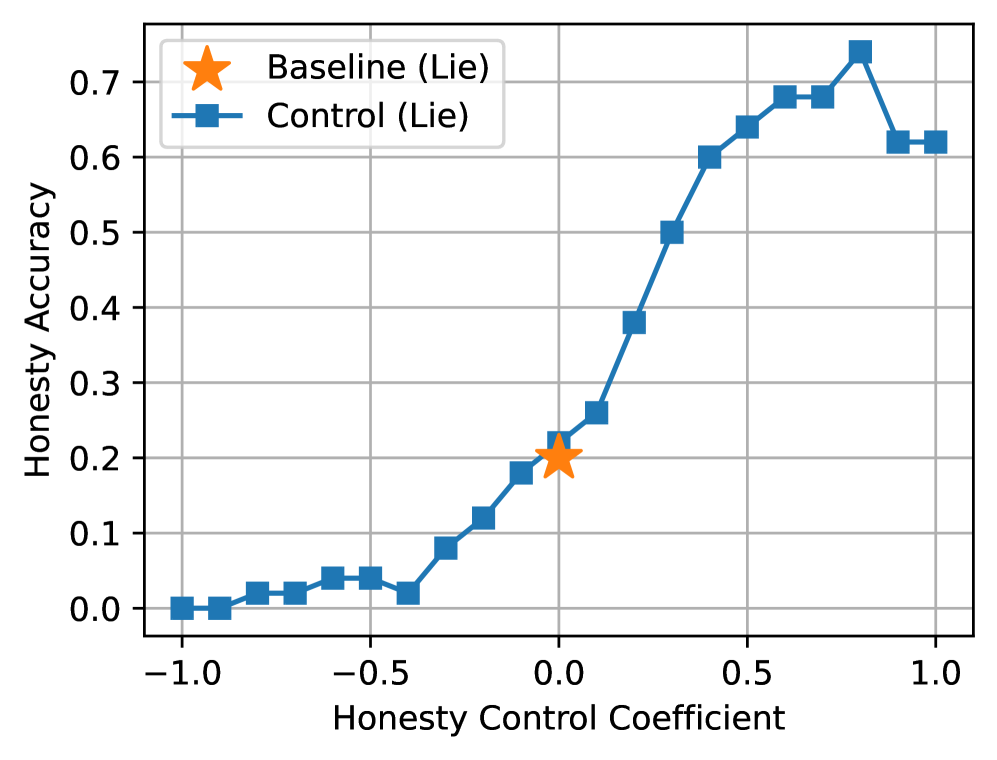
The image is a line graph comparing two data series: "Baseline (Lie)" and "Control (Lie)" across a range of Honesty Control Coefficients. The y-axis represents Honesty Accuracy (0.0–0.7), and the x-axis represents Honesty Control Coefficient (-1.0–1.0). The graph includes a legend in the top-left corner and two distinct data series.
---
### Components/Axes
- **X-axis (Horizontal)**:
- Label: "Honesty Control Coefficient"
- Scale: -1.0 to 1.0 in increments of 0.5
- Ticks: -1.0, -0.5, 0.0, 0.5, 1.0
- **Y-axis (Vertical)**:
- Label: "Honesty Accuracy"
- Scale: 0.0 to 0.7 in increments of 0.1
- Ticks: 0.0, 0.1, 0.2, 0.3, 0.4, 0.5, 0.6, 0.7
- **Legend**:
- Position: Top-left corner
- Entries:
- **Baseline (Lie)**: Orange star marker
- **Control (Lie)**: Blue square marker
---
### Detailed Analysis
1. **Baseline (Lie)**:
- A single data point marked with an orange star.
- Position: (0.0, 0.2) on the graph.
2. **Control (Lie)**:
- A line with blue square markers.
- Trend:
- Starts at (-1.0, 0.0).
- Gradually increases to a peak at (0.8, 0.7).
- Slight dip after 0.8, stabilizing near 0.65 at 1.0.
- Key Points:
- (0.0, 0.2) – Matches Baseline’s value.
- (0.5, 0.6) – Midpoint of the upward trend.
- (0.8, 0.7) – Peak accuracy.
---
### Key Observations
- **Baseline (Lie)**:
- Fixed at 0.2 accuracy regardless of the Honesty Control Coefficient.
- No variability or trend observed.
- **Control (Lie)**:
- Positive correlation between Honesty Control Coefficient and Honesty Accuracy.
- Accuracy increases sharply from -1.0 to 0.8, then plateaus.
- Outlier: The dip after 0.8 suggests a potential anomaly or threshold effect.
---
### Interpretation
- **Relationship Between Variables**:
- The Control (Lie) series demonstrates that higher Honesty Control Coefficients (closer to 1.0) are associated with higher Honesty Accuracy, suggesting a direct relationship.
- The Baseline (Lie) remains constant, implying it is unaffected by the Honesty Control Coefficient.
- **Notable Patterns**:
- The Control series’ sharp rise indicates a critical threshold (around 0.5–0.8) where accuracy stabilizes.
- The Baseline’s fixed value may represent a control group or baseline condition unaffected by experimental variables.
- **Anomalies**:
- The dip in Control accuracy after 0.8 warrants further investigation—could indicate diminishing returns or external factors.
- **Practical Implications**:
- Optimizing Honesty Control Coefficients may improve accuracy in systems modeled by the Control series.
- The Baseline’s stagnation highlights the need for alternative strategies to enhance accuracy in its context.