## Diagram: Feynman Diagram Transformations
### Overview
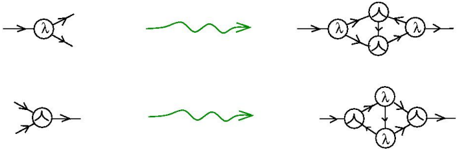
The image presents two rows of diagrams, each depicting a transformation of a Feynman diagram. Each row starts with a simple diagram, transitions via a green wavy arrow, and ends with a more complex diagram. The diagrams involve vertices, internal lines, and external lines, with some vertices labeled with "λ".
### Components/Axes
* **Vertices:** Represented by circles, some containing the label "λ".
* **Lines:** Represented by arrows, indicating the direction of particle flow.
* **Green Wavy Arrows:** Indicate a transformation or equivalence between the diagrams.
### Detailed Analysis
**Row 1:**
1. **Initial Diagram:** A vertex labeled "λ" with one incoming line and two outgoing lines.
2. **Transformation:** A green wavy arrow pointing to the right.
3. **Final Diagram:** A more complex diagram consisting of four vertices. Three vertices are labeled "λ". The diagram has one incoming line and one outgoing line. The vertices are connected by internal lines with arrows indicating flow.
**Row 2:**
1. **Initial Diagram:** A vertex labeled "λ" with two incoming lines and one outgoing line.
2. **Transformation:** A green wavy arrow pointing to the right.
3. **Final Diagram:** A more complex diagram consisting of four vertices. Two vertices are labeled "λ". The diagram has one incoming line and one outgoing line. The vertices are connected by internal lines with arrows indicating flow.
### Key Observations
* The green wavy arrows indicate a transformation or equivalence between the diagrams on either side.
* The diagrams represent interactions between particles, with the arrows indicating the direction of particle flow.
* The "λ" label likely represents a coupling constant or interaction strength.
* The transformations increase the complexity of the diagrams, suggesting a process of expanding or resolving interactions.
### Interpretation
The diagrams illustrate a process of transforming Feynman diagrams, possibly representing a simplification or expansion of interactions in a quantum field theory calculation. The green wavy arrows suggest that the diagrams on either side are equivalent in some sense, perhaps representing different ways of calculating the same physical process. The "λ" labels likely represent coupling constants, which determine the strength of the interactions. The transformations may be used to simplify calculations or to reveal underlying structures in the theory.