\n
## Diagram: Network Transformation
### Overview
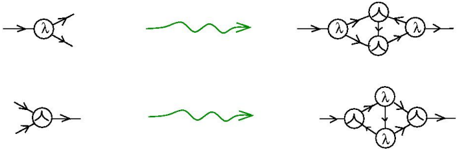
The image presents a visual representation of network transformations. It depicts two initial network structures on the left, a transformation symbol in the center, and the resulting network structures on the right. The diagrams illustrate a process where simpler networks are expanded into more complex ones.
### Components/Axes
The diagram consists of:
* **Nodes:** Represented by circles, some containing the symbol "λ".
* **Arrows:** Indicate the direction of flow or connection between nodes.
* **Transformation Symbol:** A green, wavy arrow pointing to the right.
* **Initial Networks:** Two networks on the left side of the diagram.
* **Resulting Networks:** Two networks on the right side of the diagram.
### Detailed Analysis or Content Details
**Top Row:**
* **Initial Network:** A single node labeled "λ" with three outgoing arrows.
* **Transformation:** The green wavy arrow.
* **Resulting Network:** A network consisting of four nodes. One node is labeled "λ". Three other nodes are connected to the "λ" node, and all four nodes have a single outgoing arrow. The connections between the nodes are represented by lines.
**Bottom Row:**
* **Initial Network:** A single node labeled "λ" with three incoming arrows.
* **Transformation:** The green wavy arrow.
* **Resulting Network:** A network consisting of four nodes. One node is labeled "λ". Three other nodes are connected to the "λ" node, and all four nodes have a single outgoing arrow. The connections between the nodes are represented by lines.
### Key Observations
* The transformation consistently expands a single node network into a network with four nodes.
* The symbol "λ" is present in both the initial and resulting networks.
* The transformation appears to add complexity to the network structure.
* The initial networks differ only in the direction of the arrows (incoming vs. outgoing).
### Interpretation
The diagram likely illustrates a process of network expansion or branching. The "λ" symbol could represent a specific element or function within the network. The transformation symbol suggests a process that takes a simple network and creates a more complex one, potentially representing replication, diversification, or the introduction of new elements. The difference between the top and bottom rows suggests that the direction of input/output influences the resulting network structure. The diagram could be used to model processes in various fields, such as biology (gene regulation), computer science (network architecture), or physics (particle interactions). The lack of quantitative data limits a deeper analysis, but the visual representation clearly demonstrates a consistent transformation pattern.