## Bar Chart: 5-gram Repetition Rate for Correct and Incorrect Answers
### Overview
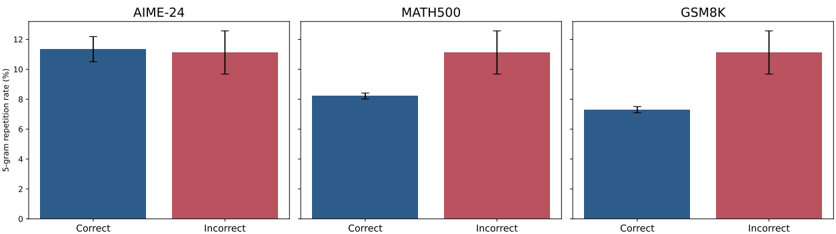
The image presents three bar charts comparing the 5-gram repetition rate (%) for correct and incorrect answers across three datasets: AIME-24, MATH500, and GSM8K. Each chart displays two bars, one for correct answers (blue) and one for incorrect answers (red), with error bars indicating variability.
### Components/Axes
* **X-axis:** Categorical axis with two categories: "Correct" and "Incorrect".
* **Y-axis:** Numerical axis labeled "5-gram repetition rate (%)", ranging from 0 to 12. Axis markers are present at intervals of 2 (0, 2, 4, 6, 8, 10, 12).
* **Chart Titles:** Three titles above each chart: "AIME-24", "MATH500", and "GSM8K".
* **Bar Colors:** Blue for "Correct" answers, Red for "Incorrect" answers.
* **Error Bars:** Black vertical lines extending above each bar, representing the standard deviation or confidence interval.
### Detailed Analysis
**AIME-24**
* **Correct (Blue):** The bar extends to approximately 11.4%.
* **Incorrect (Red):** The bar extends to approximately 11.1%.
* **Error Bars:** The error bars extend approximately +/- 1% from the top of each bar.
**MATH500**
* **Correct (Blue):** The bar extends to approximately 8.2%.
* **Incorrect (Red):** The bar extends to approximately 11.2%.
* **Error Bars:** The error bars extend approximately +/- 1% from the top of each bar.
**GSM8K**
* **Correct (Blue):** The bar extends to approximately 7.3%.
* **Incorrect (Red):** The bar extends to approximately 11.1%.
* **Error Bars:** The error bars extend approximately +/- 1% from the top of each bar.
### Key Observations
* For AIME-24, the 5-gram repetition rate is similar for both correct and incorrect answers.
* For MATH500 and GSM8K, the 5-gram repetition rate is noticeably higher for incorrect answers compared to correct answers.
* The error bars suggest some variability in the data, but the difference between correct and incorrect answers in MATH500 and GSM8K appears significant.
### Interpretation
The data suggests that for the MATH500 and GSM8K datasets, there is a correlation between higher 5-gram repetition rates and incorrect answers. This could indicate that when the model generates incorrect answers, it tends to repeat certain sequences of words more frequently. In contrast, the AIME-24 dataset does not show this pattern, suggesting that the repetition rate is not a strong indicator of correctness for this particular dataset. The difference in repetition rates between correct and incorrect answers might be a useful metric for identifying and potentially mitigating errors in the MATH500 and GSM8K datasets.