\n
## Bar Chart: 5-gram Repetition Rate for Different Datasets
### Overview
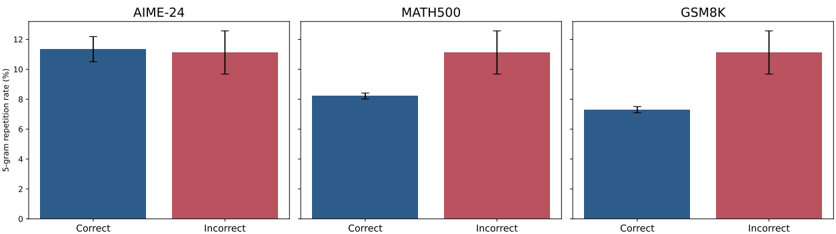
This image presents a bar chart comparing the 5-gram repetition rate for "Correct" and "Incorrect" responses across three datasets: AIME-24, MATH500, and GSM8K. Each dataset is represented by a separate set of bars, with blue bars indicating the repetition rate for correct responses and red bars for incorrect responses. Error bars are present on top of each bar, indicating the variability or confidence interval.
### Components/Axes
* **X-axis:** Categorical, labeled "Correct" and "Incorrect".
* **Y-axis:** Numerical, labeled "5-gram repetition rate (%)", ranging from 0 to 12.
* **Datasets:** AIME-24, MATH500, GSM8K (displayed as titles above each set of bars).
* **Bar Colors:** Blue for "Correct", Red for "Incorrect".
* **Error Bars:** Black vertical lines indicating standard error or confidence intervals.
### Detailed Analysis
The chart consists of three sub-charts, one for each dataset.
**AIME-24:**
* **Correct:** The blue bar representing "Correct" responses has a height of approximately 11.2% ± 0.6%. The bar is positioned on the left side of the chart.
* **Incorrect:** The red bar representing "Incorrect" responses has a height of approximately 11.5% ± 0.7%. The bar is positioned on the right side of the chart.
**MATH500:**
* **Correct:** The blue bar representing "Correct" responses has a height of approximately 7.5% ± 0.4%. The bar is positioned on the left side of the chart.
* **Incorrect:** The red bar representing "Incorrect" responses has a height of approximately 11.2% ± 0.6%. The bar is positioned on the right side of the chart.
**GSM8K:**
* **Correct:** The blue bar representing "Correct" responses has a height of approximately 6.5% ± 0.4%. The bar is positioned on the left side of the chart.
* **Incorrect:** The red bar representing "Incorrect" responses has a height of approximately 11.0% ± 0.6%. The bar is positioned on the right side of the chart.
### Key Observations
* In all three datasets, the 5-gram repetition rate is higher for "Incorrect" responses than for "Correct" responses.
* The difference between the repetition rates for "Correct" and "Incorrect" responses is most pronounced in the MATH500 and GSM8K datasets.
* The AIME-24 dataset shows a minimal difference in repetition rates between correct and incorrect responses.
* The error bars suggest that the differences observed are statistically significant, but the variability within each category should be considered.
### Interpretation
The data suggests that a higher 5-gram repetition rate is associated with incorrect responses across all three datasets. This could indicate that incorrect responses are more likely to contain repetitive phrasing or patterns, potentially due to the model getting stuck in a loop or failing to generate diverse outputs. The larger difference in MATH500 and GSM8K suggests that this effect is more pronounced in these datasets, possibly due to the nature of the tasks or the complexity of the data. The relatively small difference in AIME-24 might indicate that the task is simpler or that the model performs better on this specific dataset. The error bars provide a measure of uncertainty, and it's important to consider these when interpreting the results. The repetition rate could be a useful metric for identifying and filtering out potentially incorrect or low-quality responses from language models.