\n
## Bar Chart: 5-gram Repetition Rate by Correctness Across Datasets
### Overview
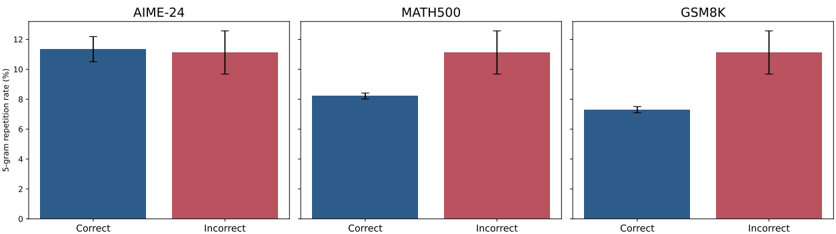
The image displays a set of three grouped bar charts arranged horizontally. Each chart compares the "5-gram repetition rate (%)" for "Correct" versus "Incorrect" responses across three distinct datasets or benchmarks: AIME-24, MATH500, and GSM8K. The charts share a common y-axis scale and visual design, using blue bars for "Correct" and red bars for "Incorrect". Each bar includes an error bar indicating variability or confidence intervals.
### Components/Axes
* **Chart Type:** Grouped bar chart with error bars.
* **Panels:** Three panels, each titled at the top center:
1. **Left Panel:** `AIME-24`
2. **Center Panel:** `MATH500`
3. **Right Panel:** `GSM8K`
* **Y-Axis (Common to all panels):**
* **Label:** `5-gram repetition rate (%)` (rotated vertically, positioned to the left of the leftmost panel).
* **Scale:** Linear scale from 0 to 12, with major tick marks at 0, 2, 4, 6, 8, 10, 12.
* **X-Axis (Within each panel):**
* **Categories:** Two categories per panel: `Correct` (left bar) and `Incorrect` (right bar).
* **Legend/Color Coding:**
* **Blue Bar:** Represents the `Correct` category.
* **Red Bar:** Represents the `Incorrect` category.
* The legend is implicitly defined by the x-axis labels directly beneath each bar.
* **Error Bars:** Each bar has a black, vertical error bar extending above and below the top of the bar, indicating the range of uncertainty or standard deviation.
### Detailed Analysis
**Panel 1: AIME-24**
* **Correct (Blue Bar):** The bar height is approximately 11.2%. The error bar extends from roughly 10.5% to 12.0%.
* **Incorrect (Red Bar):** The bar height is approximately 11.0%. The error bar extends from roughly 9.8% to 12.2%.
* **Trend:** The repetition rates for correct and incorrect responses are very similar, with overlapping error bars. The "Correct" rate is marginally higher.
**Panel 2: MATH500**
* **Correct (Blue Bar):** The bar height is approximately 8.2%. The error bar is relatively small, extending from about 8.0% to 8.4%.
* **Incorrect (Red Bar):** The bar height is approximately 11.0%. The error bar extends from roughly 9.8% to 12.2%.
* **Trend:** There is a clear and substantial difference. The repetition rate for incorrect responses is notably higher than for correct responses. The error bars do not overlap.
**Panel 3: GSM8K**
* **Correct (Blue Bar):** The bar height is approximately 7.2%. The error bar is small, extending from about 7.0% to 7.4%.
* **Incorrect (Red Bar):** The bar height is approximately 11.0%. The error bar extends from roughly 9.8% to 12.2%.
* **Trend:** This panel shows the largest disparity. The repetition rate for incorrect responses is significantly higher than for correct responses. The error bars do not overlap.
### Key Observations
1. **Consistency of Incorrect Rate:** The 5-gram repetition rate for `Incorrect` responses is remarkably consistent across all three datasets, hovering around 11.0% (AIME-24: ~11.0%, MATH500: ~11.0%, GSM8K: ~11.0%).
2. **Variability of Correct Rate:** The repetition rate for `Correct` responses varies significantly by dataset: highest in AIME-24 (~11.2%), lower in MATH500 (~8.2%), and lowest in GSM8K (~7.2%).
3. **Magnitude of Difference:** The gap between incorrect and correct repetition rates increases from left to right across the panels: negligible in AIME-24, moderate in MATH500, and large in GSM8K.
4. **Error Bar Patterns:** The error bars for the `Incorrect` category are consistently larger than those for the `Correct` category, suggesting greater variability in the repetition rate of incorrect answers.
### Interpretation
This data suggests a potential correlation between the linguistic diversity of a model's output and the correctness of its reasoning. A lower 5-gram repetition rate indicates less repetitive, more varied language.
* **For the AIME-24 dataset,** the similarity in repetition rates between correct and incorrect answers implies that linguistic repetition is not a strong indicator of correctness for this particular benchmark. The problems may be structured such that both correct and incorrect solution paths involve similar levels of formulaic language.
* **For the MATH500 and GSM8K datasets,** the clear pattern—where incorrect answers have a higher repetition rate—suggests that when the model fails, it may fall back on more repetitive, templated, or less thoughtfully constructed language. Conversely, correct reasoning appears to be associated with more diverse and flexible language generation.
* **The increasing gap** from AIME-24 to GSM8K could indicate that the nature of the tasks differs. GSM8K (grade school math) might allow for more varied correct solution explanations, while incorrect attempts become highly repetitive. The consistency of the `Incorrect` rate (~11%) across diverse tasks is striking and may point to a baseline level of repetition in the model's failure modes.
In summary, the chart provides evidence that for certain reasoning tasks (MATH500, GSM8K), the *how* (linguistic diversity) of the model's response is linked to the *what* (correctness). This could be a useful diagnostic signal: high repetition might flag a higher likelihood of an incorrect answer in specific contexts.