## Line Chart: NDCG@10/% vs. Dimensions for Different Methods
### Overview
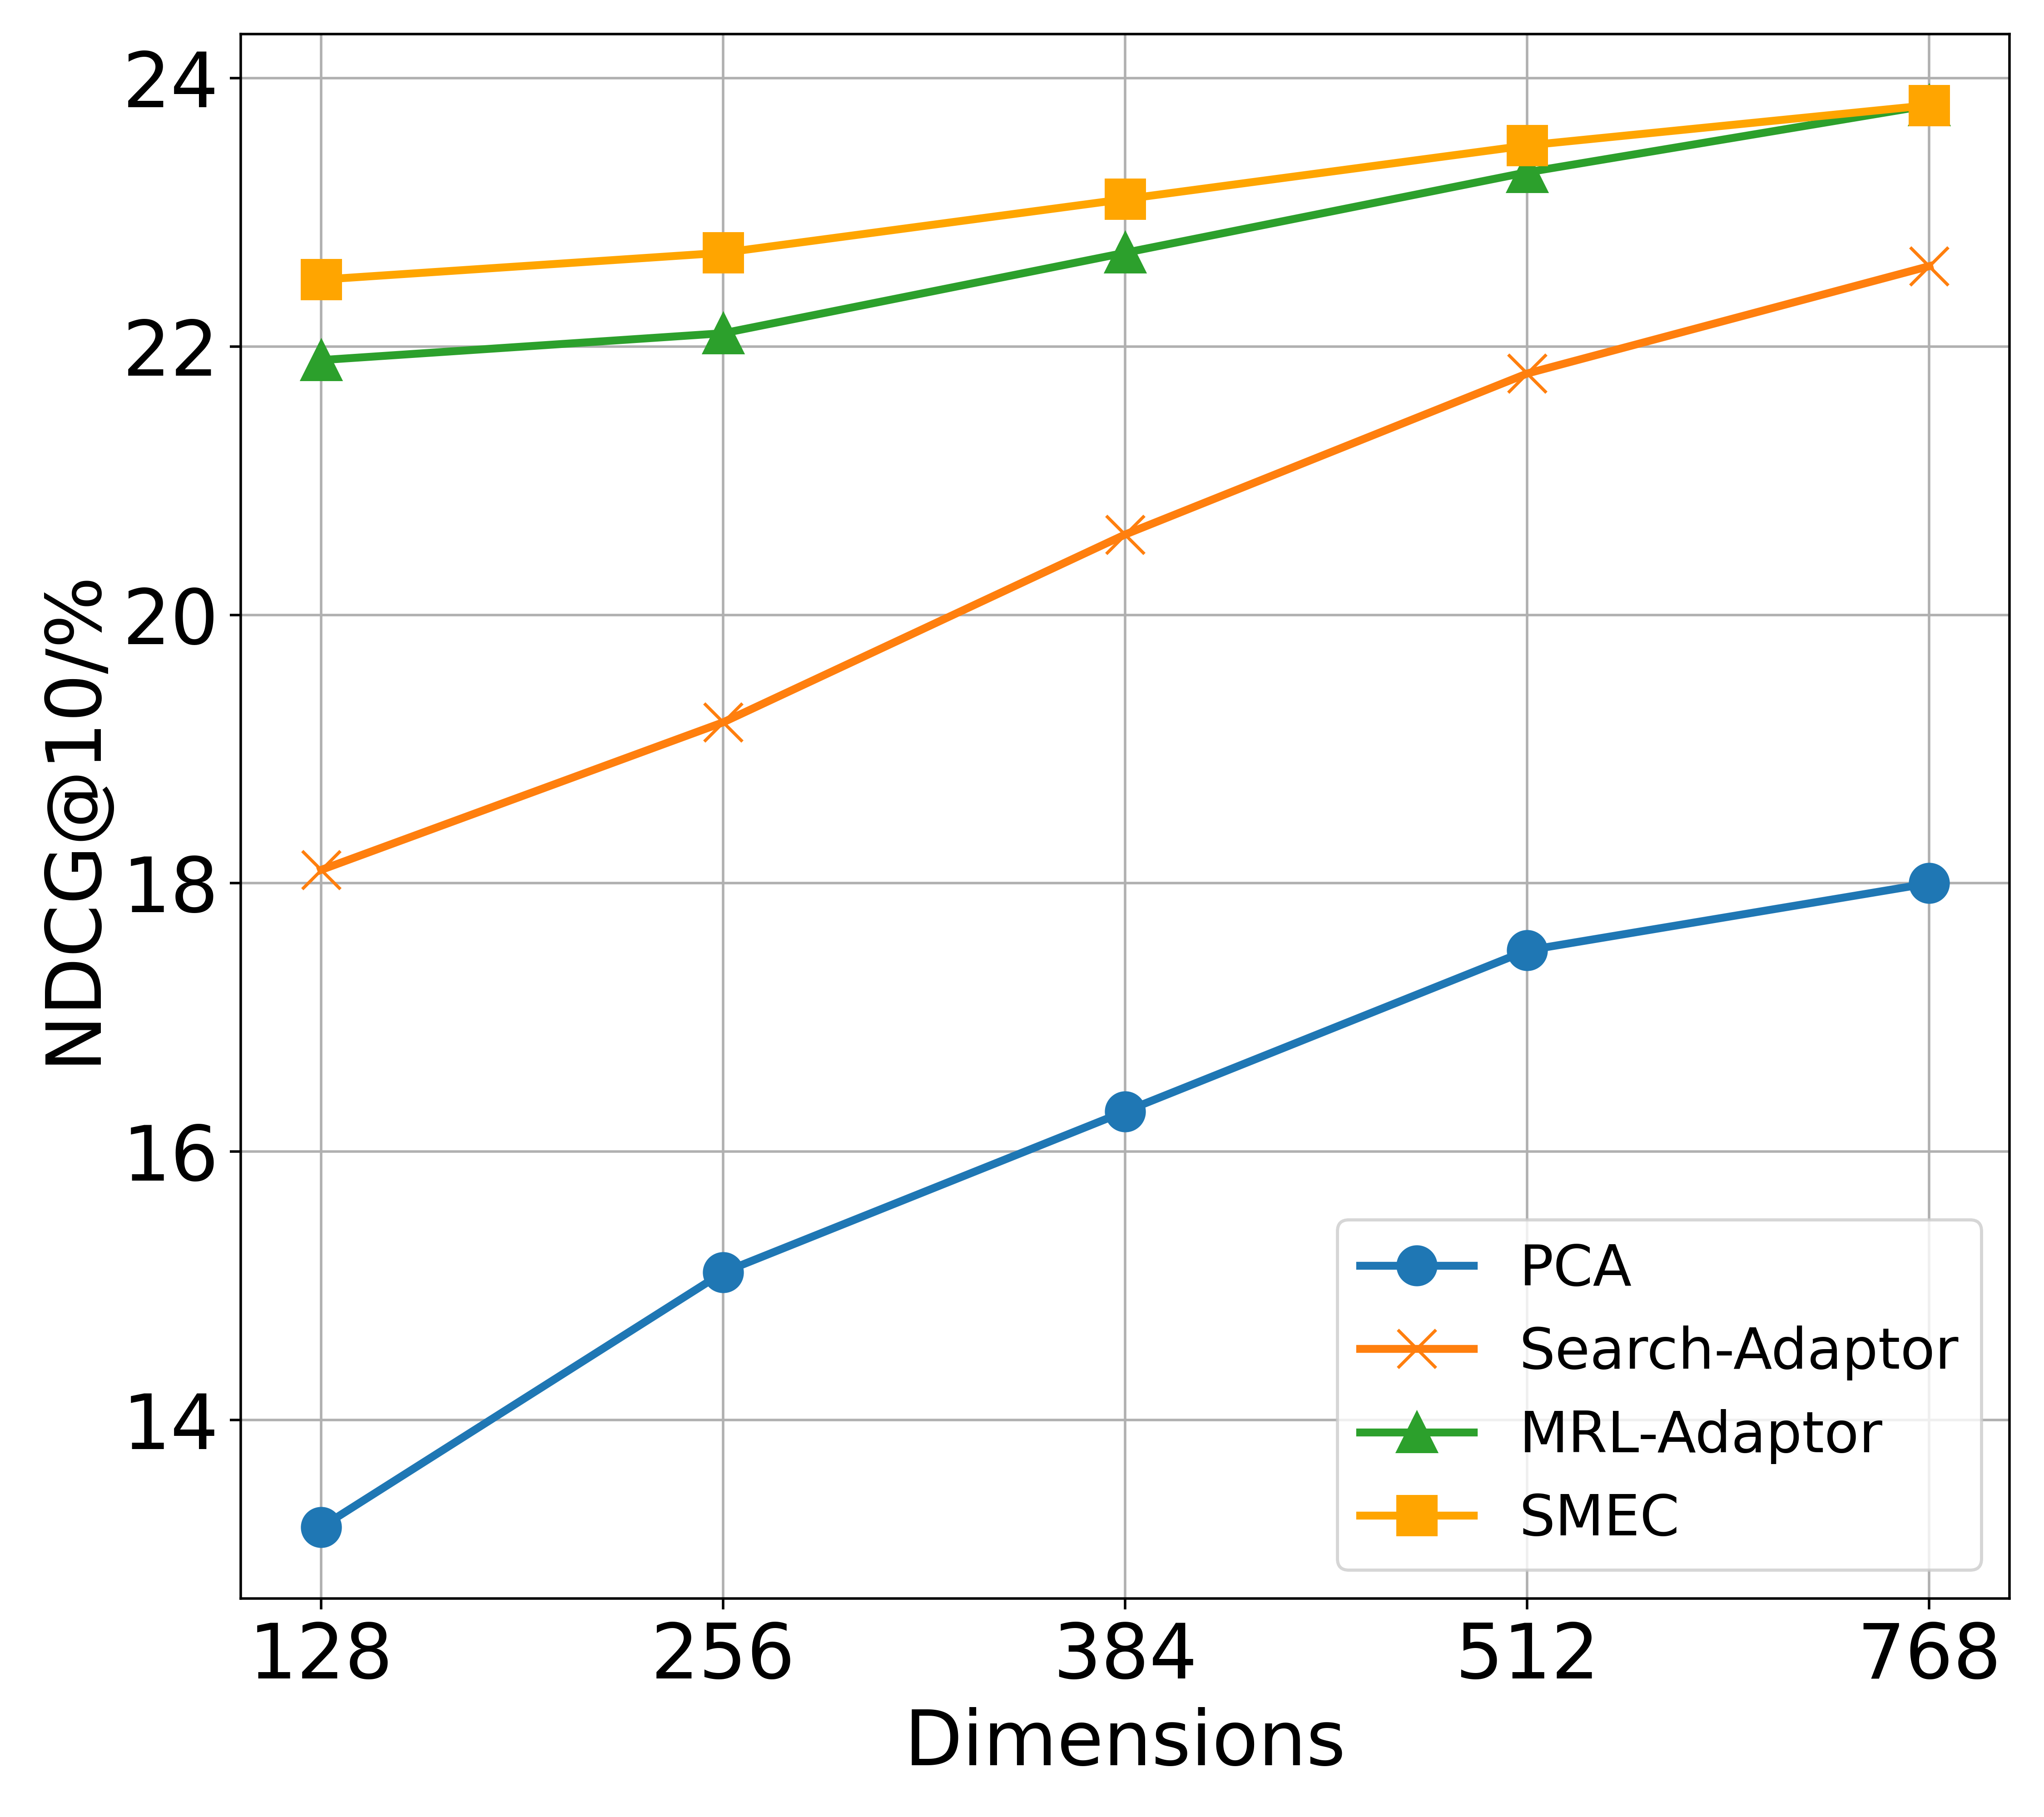
The image is a line chart comparing the performance of four different methods (PCA, Search-Adaptor, MRL-Adaptor, and SMEC) based on their NDCG@10/% scores across varying dimensions. The chart displays how the NDCG@10/% score changes as the number of dimensions increases from 128 to 768.
### Components/Axes
* **X-axis (Horizontal):** "Dimensions" with tick marks at 128, 256, 384, 512, and 768.
* **Y-axis (Vertical):** "NDCG@10/%" with tick marks at 14, 16, 18, 20, 22, and 24.
* **Legend (Bottom-Right):**
* Blue line with circle markers: PCA
* Orange line with cross markers: Search-Adaptor
* Green line with triangle markers: MRL-Adaptor
* Yellow/Orange line with square markers: SMEC
### Detailed Analysis
* **PCA (Blue):** The blue line, representing PCA, shows a generally upward trend.
* At 128 dimensions, NDCG@10/% is approximately 13.2.
* At 256 dimensions, NDCG@10/% is approximately 15.1.
* At 384 dimensions, NDCG@10/% is approximately 16.3.
* At 512 dimensions, NDCG@10/% is approximately 17.5.
* At 768 dimensions, NDCG@10/% is approximately 18.0.
* **Search-Adaptor (Orange):** The orange line, representing Search-Adaptor, shows a consistent upward trend.
* At 128 dimensions, NDCG@10/% is approximately 18.1.
* At 256 dimensions, NDCG@10/% is approximately 19.2.
* At 384 dimensions, NDCG@10/% is approximately 20.6.
* At 512 dimensions, NDCG@10/% is approximately 21.8.
* At 768 dimensions, NDCG@10/% is approximately 22.6.
* **MRL-Adaptor (Green):** The green line, representing MRL-Adaptor, shows a slight upward trend.
* At 128 dimensions, NDCG@10/% is approximately 21.9.
* At 256 dimensions, NDCG@10/% is approximately 22.1.
* At 384 dimensions, NDCG@10/% is approximately 22.7.
* At 512 dimensions, NDCG@10/% is approximately 23.3.
* At 768 dimensions, NDCG@10/% is approximately 23.8.
* **SMEC (Yellow/Orange):** The yellow/orange line, representing SMEC, shows a slight upward trend.
* At 128 dimensions, NDCG@10/% is approximately 22.5.
* At 256 dimensions, NDCG@10/% is approximately 22.7.
* At 384 dimensions, NDCG@10/% is approximately 23.1.
* At 512 dimensions, NDCG@10/% is approximately 23.4.
* At 768 dimensions, NDCG@10/% is approximately 23.9.
### Key Observations
* PCA consistently performs the worst among the four methods across all dimensions.
* Search-Adaptor shows the most significant improvement in NDCG@10/% as dimensions increase.
* MRL-Adaptor and SMEC perform similarly and generally outperform PCA and Search-Adaptor.
* The performance of MRL-Adaptor and SMEC plateaus as dimensions increase beyond 512.
### Interpretation
The chart illustrates the impact of dimensionality on the performance of different methods, as measured by NDCG@10/%. PCA's lower performance suggests it may not be as effective in capturing relevant information in lower dimensions compared to the other methods. Search-Adaptor benefits significantly from increased dimensionality, indicating it can leverage additional features to improve its ranking performance. MRL-Adaptor and SMEC achieve higher NDCG@10/% scores, suggesting they are more robust or better suited for this particular task. The plateauing of MRL-Adaptor and SMEC suggests that there may be diminishing returns in increasing dimensions beyond a certain point, possibly due to overfitting or the introduction of irrelevant features.