## Line Chart: NDCG@10% vs. Dimensions
### Overview
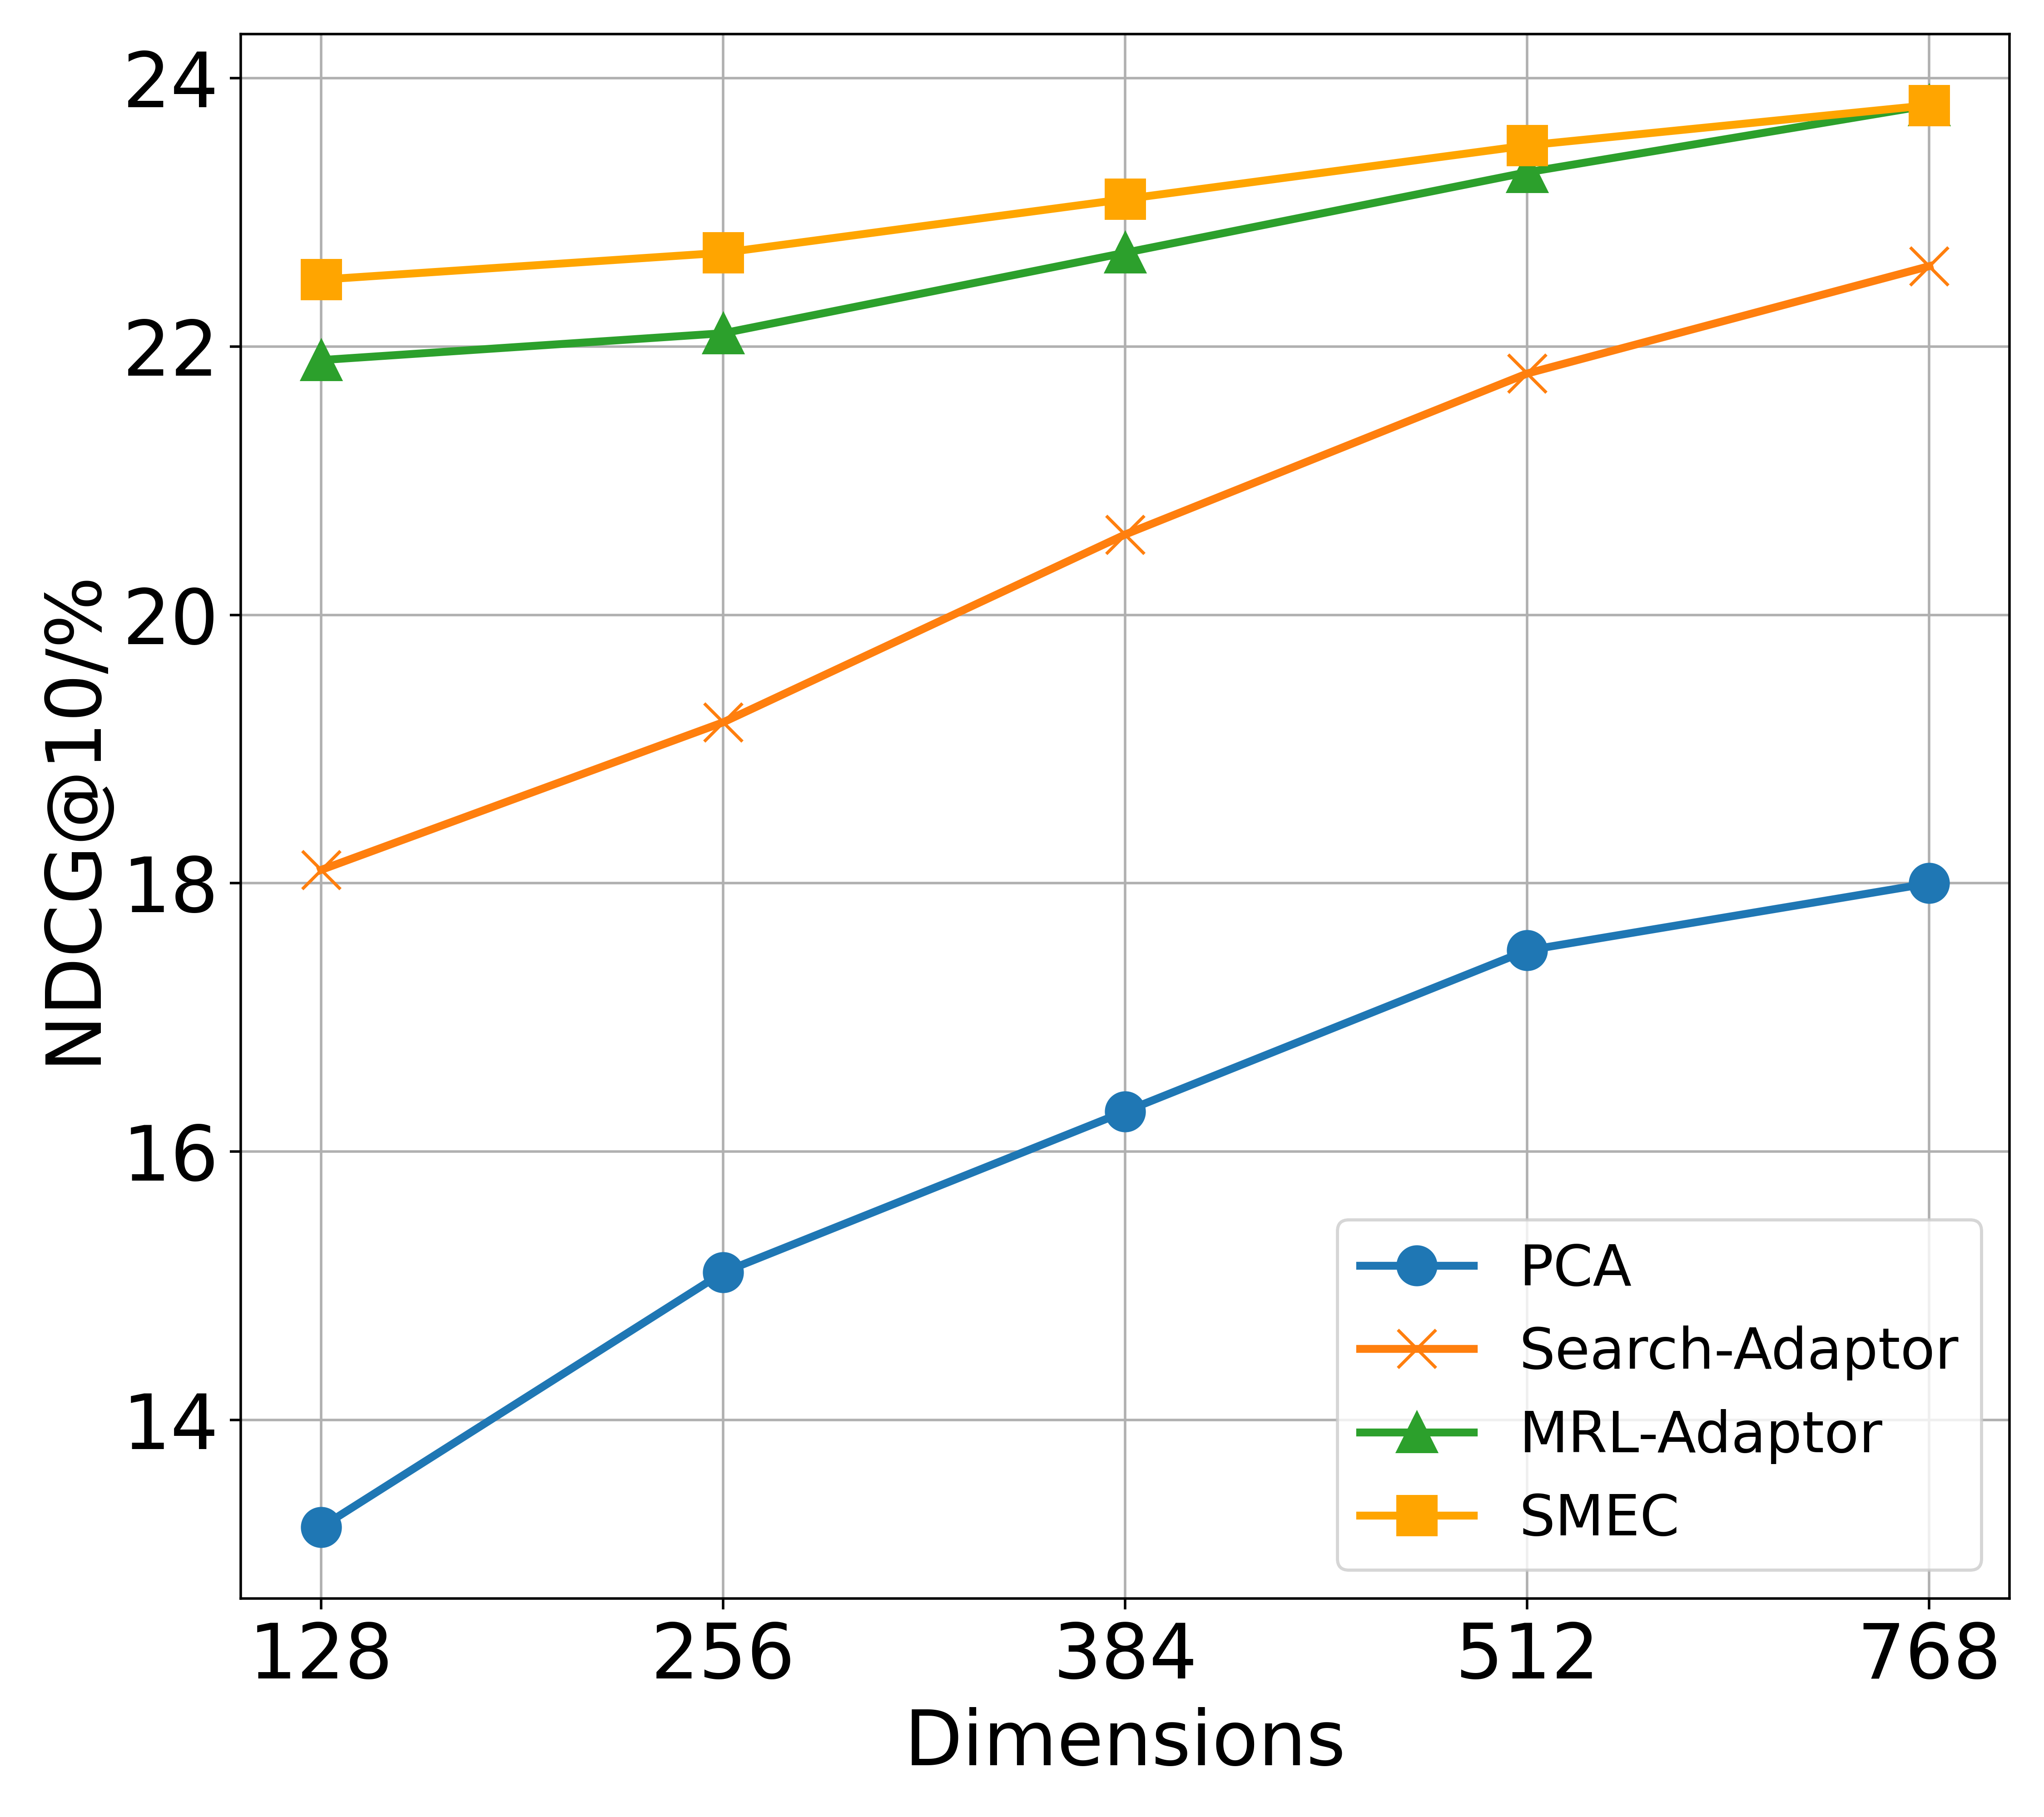
This line chart displays the relationship between the number of dimensions and the NDCG@10% metric for four different methods: PCA, Search-Adaptor, MRL-Adaptor, and SMEC. The x-axis represents the dimensions, ranging from 128 to 768, while the y-axis represents the NDCG@10% score, ranging from 14 to 24.
### Components/Axes
* **X-axis Title:** Dimensions
* **Y-axis Title:** NDCG@10%
* **X-axis Markers:** 128, 256, 384, 512, 768
* **Y-axis Markers:** 14, 16, 18, 20, 22, 24
* **Legend:** Located in the bottom-right corner.
* PCA (Blue Circle)
* Search-Adaptor (Orange X)
* MRL-Adaptor (Green Triangle)
* SMEC (Yellow Square)
### Detailed Analysis
* **PCA (Blue Line):** The line slopes upward, indicating an increase in NDCG@10% as the number of dimensions increases.
* At 128 dimensions: Approximately 13.2 NDCG@10%
* At 256 dimensions: Approximately 15.1 NDCG@10%
* At 384 dimensions: Approximately 16.3 NDCG@10%
* At 512 dimensions: Approximately 17.5 NDCG@10%
* At 768 dimensions: Approximately 18.5 NDCG@10%
* **Search-Adaptor (Orange Line):** The line also slopes upward, but with a steeper initial increase than PCA.
* At 128 dimensions: Approximately 18.1 NDCG@10%
* At 256 dimensions: Approximately 19.3 NDCG@10%
* At 384 dimensions: Approximately 21.1 NDCG@10%
* At 512 dimensions: Approximately 22.4 NDCG@10%
* At 768 dimensions: Approximately 22.8 NDCG@10%
* **MRL-Adaptor (Green Line):** This line is relatively flat, with a slight upward trend. It starts at a higher NDCG@10% than PCA and Search-Adaptor.
* At 128 dimensions: Approximately 22.2 NDCG@10%
* At 256 dimensions: Approximately 22.3 NDCG@10%
* At 384 dimensions: Approximately 22.8 NDCG@10%
* At 512 dimensions: Approximately 23.2 NDCG@10%
* At 768 dimensions: Approximately 23.4 NDCG@10%
* **SMEC (Yellow Line):** This line shows an upward trend, similar to Search-Adaptor, but starts at a similar level to MRL-Adaptor.
* At 128 dimensions: Approximately 22.4 NDCG@10%
* At 256 dimensions: Approximately 22.6 NDCG@10%
* At 384 dimensions: Approximately 23.2 NDCG@10%
* At 512 dimensions: Approximately 23.8 NDCG@10%
* At 768 dimensions: Approximately 24.0 NDCG@10%
### Key Observations
* MRL-Adaptor and SMEC consistently achieve the highest NDCG@10% scores across all dimensions.
* PCA shows the lowest NDCG@10% scores and the most significant improvement with increasing dimensions.
* Search-Adaptor demonstrates a substantial initial increase in NDCG@10% but plateaus at higher dimensions.
* The performance of all methods appears to converge as the number of dimensions increases, with diminishing returns beyond 512 dimensions.
### Interpretation
The data suggests that increasing the number of dimensions generally improves the NDCG@10% metric for all four methods. However, the rate of improvement varies significantly. MRL-Adaptor and SMEC are the most effective methods, achieving consistently high scores, indicating they are less sensitive to the number of dimensions. PCA, while showing improvement with more dimensions, starts from a lower baseline and may require a substantial number of dimensions to reach comparable performance. The plateauing of Search-Adaptor suggests that its performance is limited by other factors beyond dimensionality.
The convergence of the lines at higher dimensions indicates a point of diminishing returns. Adding more dimensions beyond a certain point (around 512-768 in this case) does not yield significant improvements in NDCG@10%. This could be due to factors such as noise in the data or the limitations of the models themselves. The choice of method and dimensionality should be based on a trade-off between performance and computational cost.