\n
## Line Chart: Performance Comparison of Dimensionality Reduction Methods
### Overview
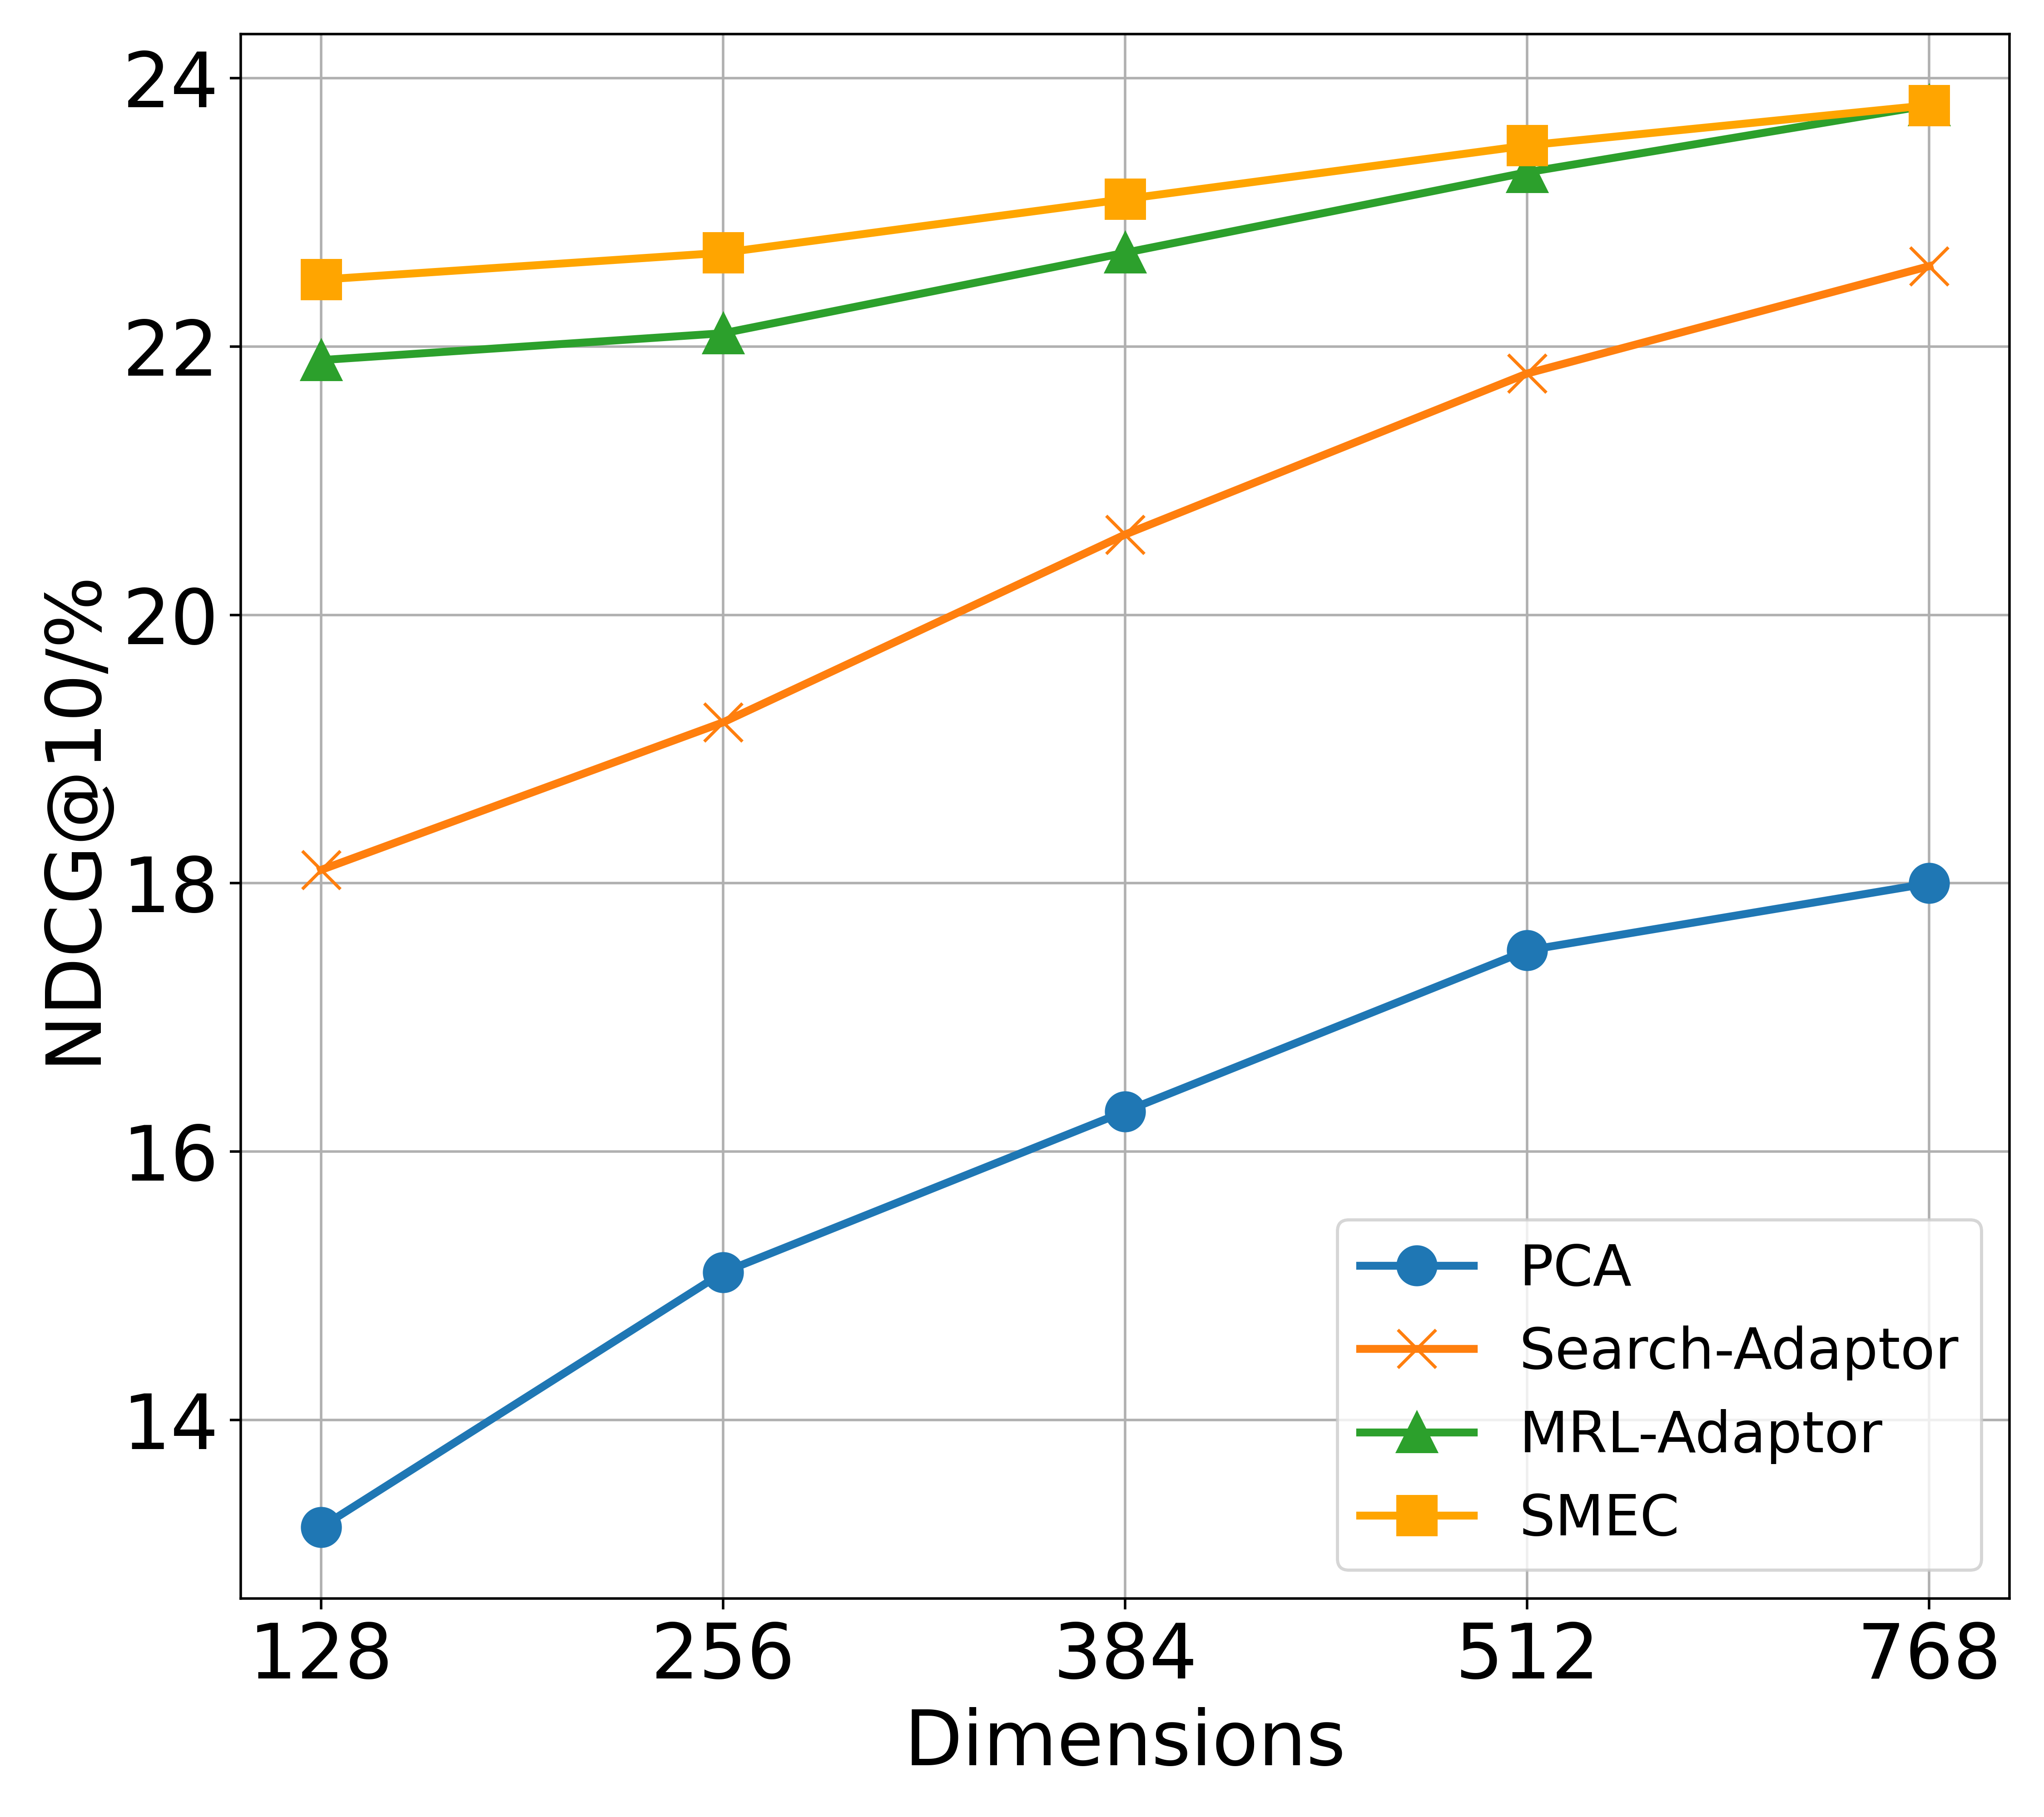
This is a line chart comparing the performance of four different dimensionality reduction or adaptation methods (PCA, Search-Adaptor, MRL-Adaptor, SMEC) across five different dimensionality settings. The performance metric is NDCG@10 (Normalized Discounted Cumulative Gain at rank 10), expressed as a percentage. The chart demonstrates how each method's effectiveness changes as the number of dimensions increases.
### Components/Axes
* **X-Axis (Horizontal):** Labeled "Dimensions". It represents the dimensionality of the data or model embedding space. The axis has five discrete, evenly spaced tick marks at values: 128, 256, 384, 512, and 768.
* **Y-Axis (Vertical):** Labeled "NDCG@10/%". It represents the performance score, with a scale ranging from approximately 13% to 24%. Major gridlines are present at intervals of 2% (14, 16, 18, 20, 22, 24).
* **Legend:** Located in the bottom-right quadrant of the chart area. It contains four entries, each associating a line color and marker style with a method name:
* **PCA:** Blue line with solid circle markers (●).
* **Search-Adaptor:** Orange line with cross markers (×).
* **MRL-Adaptor:** Green line with solid triangle markers (▲).
* **SMEC:** Yellow-orange line with solid square markers (■).
### Detailed Analysis
The chart plots four data series, each showing a positive correlation between dimensionality and NDCG@10 score.
1. **PCA (Blue line, circle markers):**
* **Trend:** Shows a steady, nearly linear upward slope. It is the lowest-performing method at all dimension points.
* **Data Points (Approximate):**
* 128 Dimensions: ~13.1%
* 256 Dimensions: ~15.1%
* 384 Dimensions: ~16.3%
* 512 Dimensions: ~17.5%
* 768 Dimensions: ~18.0%
2. **Search-Adaptor (Orange line, cross markers):**
* **Trend:** Exhibits a strong, consistent upward slope, steeper than PCA. It starts as the third-best method but closes the gap with the top performers at higher dimensions.
* **Data Points (Approximate):**
* 128 Dimensions: ~18.1%
* 256 Dimensions: ~19.2%
* 384 Dimensions: ~20.6%
* 512 Dimensions: ~21.8%
* 768 Dimensions: ~22.6%
3. **MRL-Adaptor (Green line, triangle markers):**
* **Trend:** Shows a moderate upward slope. It is the second-best performer at lower dimensions and converges with the top performer (SMEC) at the highest dimension.
* **Data Points (Approximate):**
* 128 Dimensions: ~21.9%
* 256 Dimensions: ~22.1%
* 384 Dimensions: ~22.7%
* 512 Dimensions: ~23.3%
* 768 Dimensions: ~23.8%
4. **SMEC (Yellow-orange line, square markers):**
* **Trend:** Shows a gentle upward slope. It is the top-performing method at all dimensions, though its advantage over MRL-Adaptor diminishes as dimensions increase.
* **Data Points (Approximate):**
* 128 Dimensions: ~22.5%
* 256 Dimensions: ~22.7%
* 384 Dimensions: ~23.1%
* 512 Dimensions: ~23.5%
* 768 Dimensions: ~23.8%
### Key Observations
* **Universal Improvement:** All four methods show improved NDCG@10 scores as the number of dimensions increases from 128 to 768.
* **Performance Hierarchy:** A clear and consistent performance hierarchy is maintained across most dimensions: SMEC > MRL-Adaptor > Search-Adaptor > PCA.
* **Convergence at the Top:** The performance gap between the top two methods, SMEC and MRL-Adaptor, narrows significantly. At 768 dimensions, their scores are nearly identical (~23.8%).
* **Greatest Gains:** Search-Adaptor shows the largest relative improvement, increasing its score by approximately 4.5 percentage points (from ~18.1% to ~22.6%). PCA shows the second-largest gain of about 4.9 points, but from a much lower baseline.
* **Diminishing Returns:** The rate of improvement for the top-performing methods (SMEC, MRL-Adaptor) appears to slow slightly at higher dimensions (512 to 768), suggesting potential performance saturation.
### Interpretation
This chart likely comes from a study on information retrieval, recommendation systems, or embedding compression, where NDCG is a standard metric for ranking quality. The data suggests that:
1. **Increased Dimensionality is Beneficial:** For all tested methods, allocating more dimensions (i.e., using a larger embedding or representation space) leads to better ranking performance. This is an expected trade-off between model/representation size and effectiveness.
2. **Specialized Adaptors Outperform General PCA:** The two "Adaptor" methods and SMEC significantly outperform standard PCA at all dimension levels. This indicates that task-specific or learned adaptation techniques are far more effective at preserving or enhancing retrieval-relevant information than a general-purpose linear projection like PCA.
3. **SMEC and MRL-Adaptor are State-of-the-Art:** These two methods are the top performers. SMEC holds a slight but consistent edge, except at the highest dimension where they tie. The choice between them at 768 dimensions might depend on other factors like computational cost or training stability.
4. **Search-Adaptor is a Strong Contender:** While starting lower, its steep improvement curve suggests it scales very well with dimensionality and could become competitive with the top methods at even higher dimensions not shown on the chart.
5. **Practical Implication:** For a system designer, this chart provides a clear cost-benefit analysis. If computational resources are severely constrained (low dimensions), SMEC or MRL-Adaptor are the only viable high-performance choices. If resources allow for 768 dimensions, the performance difference between the top methods becomes negligible, potentially allowing selection based on other engineering constraints.