## Bar Chart: Accuracy by Category and Row Count
### Overview
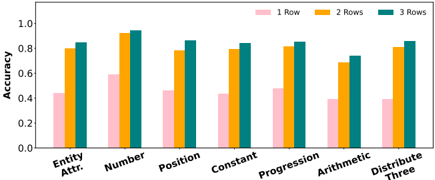
The chart compares accuracy metrics across seven categories (Entity Attr., Number, Position, Constant, Progression, Arithmetic, Distribute Three) for three row configurations (1 Row, 2 Rows, 3 Rows). Accuracy values range from 0.0 to 1.0 on the y-axis, with categories listed on the x-axis.
### Components/Axes
- **X-axis**: Categories (Entity Attr., Number, Position, Constant, Progression, Arithmetic, Distribute Three)
- **Y-axis**: Accuracy (0.0 to 1.0)
- **Legend**:
- Pink = 1 Row
- Yellow = 2 Rows
- Teal = 3 Rows
- **Title**: Implied by context (Accuracy by Category and Row Count)
### Detailed Analysis
#### Entity Attr.
- 1 Row: ~0.45 (pink)
- 2 Rows: ~0.80 (yellow)
- 3 Rows: ~0.85 (teal)
#### Number
- 1 Row: ~0.60 (pink)
- 2 Rows: ~0.92 (yellow)
- 3 Rows: ~0.95 (teal)
#### Position
- 1 Row: ~0.47 (pink)
- 2 Rows: ~0.79 (yellow)
- 3 Rows: ~0.87 (teal)
#### Constant
- 1 Row: ~0.44 (pink)
- 2 Rows: ~0.80 (yellow)
- 3 Rows: ~0.84 (teal)
#### Progression
- 1 Row: ~0.48 (pink)
- 2 Rows: ~0.82 (yellow)
- 3 Rows: ~0.86 (teal)
#### Arithmetic
- 1 Row: ~0.40 (pink)
- 2 Rows: ~0.70 (yellow)
- 3 Rows: ~0.75 (teal)
#### Distribute Three
- 1 Row: ~0.40 (pink)
- 2 Rows: ~0.81 (yellow)
- 3 Rows: ~0.85 (teal)
### Key Observations
1. **Row Count Impact**:
- 3 Rows consistently outperform 2 Rows and 1 Row across all categories.
- 2 Rows generally outperform 1 Row, though the gap narrows in Arithmetic (~0.30 difference vs. ~0.35 in other categories).
2. **Category Variability**:
- **Number** and **Distribute Three** show the largest accuracy gains with additional rows (+0.35 and +0.45 respectively from 1 to 3 Rows).
- **Arithmetic** has the smallest improvement (+0.05 from 2 to 3 Rows).
3. **Anomalies**:
- In **Number**, 2 Rows (0.92) slightly underperform 3 Rows (0.95), but the difference is minimal (~3%).
- **Arithmetic** shows a plateau in gains between 2 and 3 Rows.
### Interpretation
The data suggests that increasing row count improves accuracy, likely due to enhanced contextual representation or computational capacity. However, diminishing returns are evident in categories like Arithmetic, where adding a third row yields minimal improvement. The **Number** category’s near-parity between 2 and 3 Rows may indicate saturation or task-specific constraints. The consistent trend across categories implies that row count is a critical factor in model performance, but optimal configurations may vary by task type.